
Label Generation Dashboards
View reports for generated labels and their associated costs.
About the Label Generation dashboards
The Label Generation dashboards offer a comprehensive view of labels generated and the associated costs. These dashboards display the average cost per package based on the carrier's rate per API call, when available, when a shipping label is retrieved. The cost shown reflects the raw price directly from the carrier without any manual adjustments. Key breakdowns include carriers, service methods, locations, and weight.
There are two Label Generation dashboards:
- Label Generation Volume & Cost. This dashboard displays the number of labels generated and the associated costs, with breakdowns by origin, carrier, carrier type (national vs. regional), service method, and service method type (standard vs. expedited).
- Label Generation Data Export. This data table allows filtering by carrier, carrier type, carrier service method, service level type, origin state, destination state, cost per package (CPP), and billable weight. You can export filtered data to a CSV file.
Customer data securityWith Shipium’s reporting applications, you can count on your data being secure:
- Data encryption
- Compliance
- Access controls
- Security audits
This document provides an overview of the Label Generation dashboards, outlining their functionality, handling of data exceptions, and key definitions. You can refer to the Reporting Product Overview documentation for more general information on Shipium reporting and user roles.
Access the Label Generation dashboards
To access any dashboard, you’ll need to log in to the application:
- Go to the Shipium-provided URL.
- Log in using your credentials: email, password, and a multi-factor authentication (via phone or email).
Next, you’ll navigate to the dashboard:
-
After logging in, you’ll use the vertical menu on the left side of the screen.
-
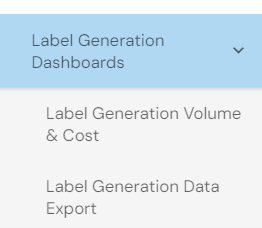
Go to the folder labeled “Label Generation Dashboards”. You’ll select any of the dashboards nested under this folder to view their particular content.
View Label Generation dashboards
This section includes instructions for each of the Label Generation dashboards as well as default settings, metrics, and data nuances for these reports. Filters for each dashboard are defined in the following table.
| Filter name | Description |
|---|---|
| Carrier ID | Name of the shipping carrier for which the label was priced (e.g., USPS, UPS, FedEx) |
| Carrier Type | Categorization of carriers as national (serving across the country) or regional (operating in specific regions) |
| Carrier Service Method | The shipping method offered by the carrier (e.g., overnight, ground) |
| Service Level Type | A classification of service methods: Expedited (3 days or less) or Standard (domestic, 4+ days) |
| Origin State | The state from which the shipment will be sent (e.g., warehouse, fulfillment center, store) |
| Destination State | The state to which the shipment is sent (e.g., customer’s residence) |
| Cost Per Package (CPP) | Cost per package sent from the carrier when the label was generated, or the cost estimated by Shipium |
| Billable Weight | The weight used to calculate the label price |
| Third Party Billing | Indicates the selected service method will be billed to a third party |
| Uncosted | Service method was not priced |
Label Generation Volume & Cost Dashboard
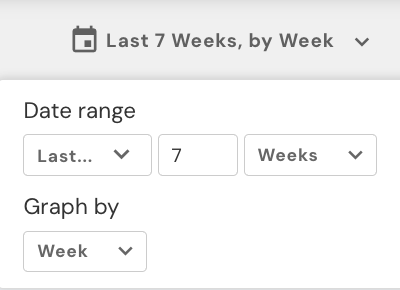
While the default setting is a label creation period of the last seven weeks, grouped by week, you can adjust the dates in the top-right corner and apply filters across the top of the dashboard.

For each filter, this dashboard provides the following reports:
- Label Count Summary
- Average Cost Per Package Summary
- Label Volume & CPP Over Time
- Label Volume Mix by Carrier Over Time
- Label Volume Mix by Carriers
- CPP by Carriers Over Time
- Label Volume Mix by Carrier Service Method Over Time
- Label Volume Mix by Carrier Service Method
- CPP by Carrier Service Method Over Time
- Label Volume Mix by Origin
- CPP by Origin Over Time
- Label Volume Mix by Carrier Type
- CPP by Carrier Type Over Time
- Label Volume Mix by Service Level Type
- CPP by Service Level Type Over Time
- Billable Weight Over Time
- CPP and Billable Weight by Carriers
- Label Volume by Origin
- Label Volume by Destination
You can also click on specific visuals (e.g., Label Volume Mix by Carrier Service Method Over Time) to filter the rest of the dashboard accordingly. For each filter, this dashboard provides the volume mix percentage and the CPP over time.
Label Generation Data Export
As with the Label Generation Volume & Cost Dashboard, you can adjust the reporting dates in the top-right corner and apply filters via the drop-downs across the top of the dashboard.
Then you can export the data table as a CSV or Excel file, with the following restrictions:
- The reporting application only supports exporting one million rows at a time.
- Data is not available at the shipment ID level.
Default settings
Each dashboard defaults to a label creation period of the last seven weeks, grouped by week. You can adjust the time period filter for any period after 1/1/2023.
Labels with a status of “failures” or “voided” are excluded by default, as these labels were either not created or were unused.
Other filters available include carrier, carrier type, carrier service method, service level type, origin state, destination state, CPP, and billable weight.
Metrics
The following metrics are provided for the Label Generation dashboards:
- Cost per package (CPP). Calculated as Label Price divided by Label Volume
- Label volume. The count of labels generated
- Label price. The cost of the label
Data nuances
The following data nuances apply to the Label Generation dashboards:
- All dashboards are based on the label creation date.
- CPP excludes uncosted, third party billing volumes, and the hundredweight service method.
- For carriers without label prices (DHL, LaserShip, Noon, TForce, UPS MI, Veho), Shipium’s calculated cost is used.
- Labels with “failures” or “voided” statuses are excluded by default because these labels were not created, or they were unused.
- The Label Generation and Rate Shop Selections dashboards will have differences in volume and costs.
- The Label Generation dashboards display the average cost per package based on the carrier's rate per API call, when available, when a shipping label is retrieved. The cost shown reflects the raw price directly from the carrier without any manual adjustments.
- The Rate Shop Selections dashboards show the average cost per package based on your organization's configured rates. The cost shown reflects any manual adjustments you have configured to influence Carrier Selection.
Resources
For assistance, reach out to your Customer Success Manager. Response times are typically within 2 to 5 business days.