Reporting Configuration
Configure your report settings in the Shipium Console.
About reporting configuration
Regardless of which Shipium report application you're using or what data you want to access, the Reporting Options Menu is where your search for insight begins. Located at the top of the screen on every reporting page, the reporting options show you the currently set options for that report as well as having a button to enable you to re-configure settings as your needs for viewing and analyzing the data change.
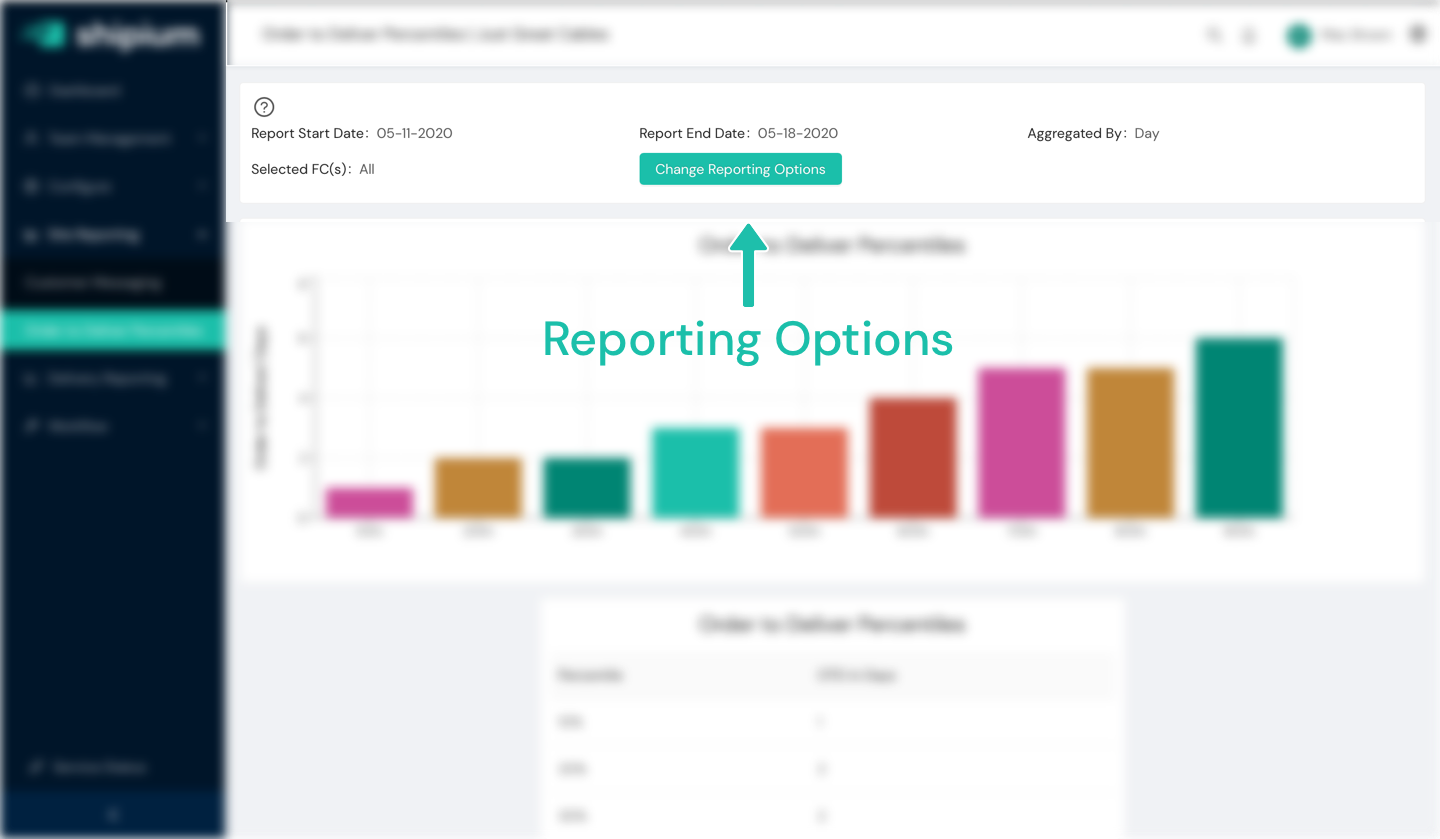
For the example above, you can see the set values for several common report options, labeled as "Reporting Options":
- Report Start Date and Report End Date. These values define the range of time that the report in question will cover.
- Aggregated By. In reports that aggregate data within some set of values (for instance, Aggregated By Day within a week's worth of data), you will have the option to set how the data is aggregated.
- Selected Fulfillment Centers. In reports that are based on data that may change from one fulfillment center to another, you can select which fulfillment center or fulfillment centers the report is filtering in or out.
Reporting options menu
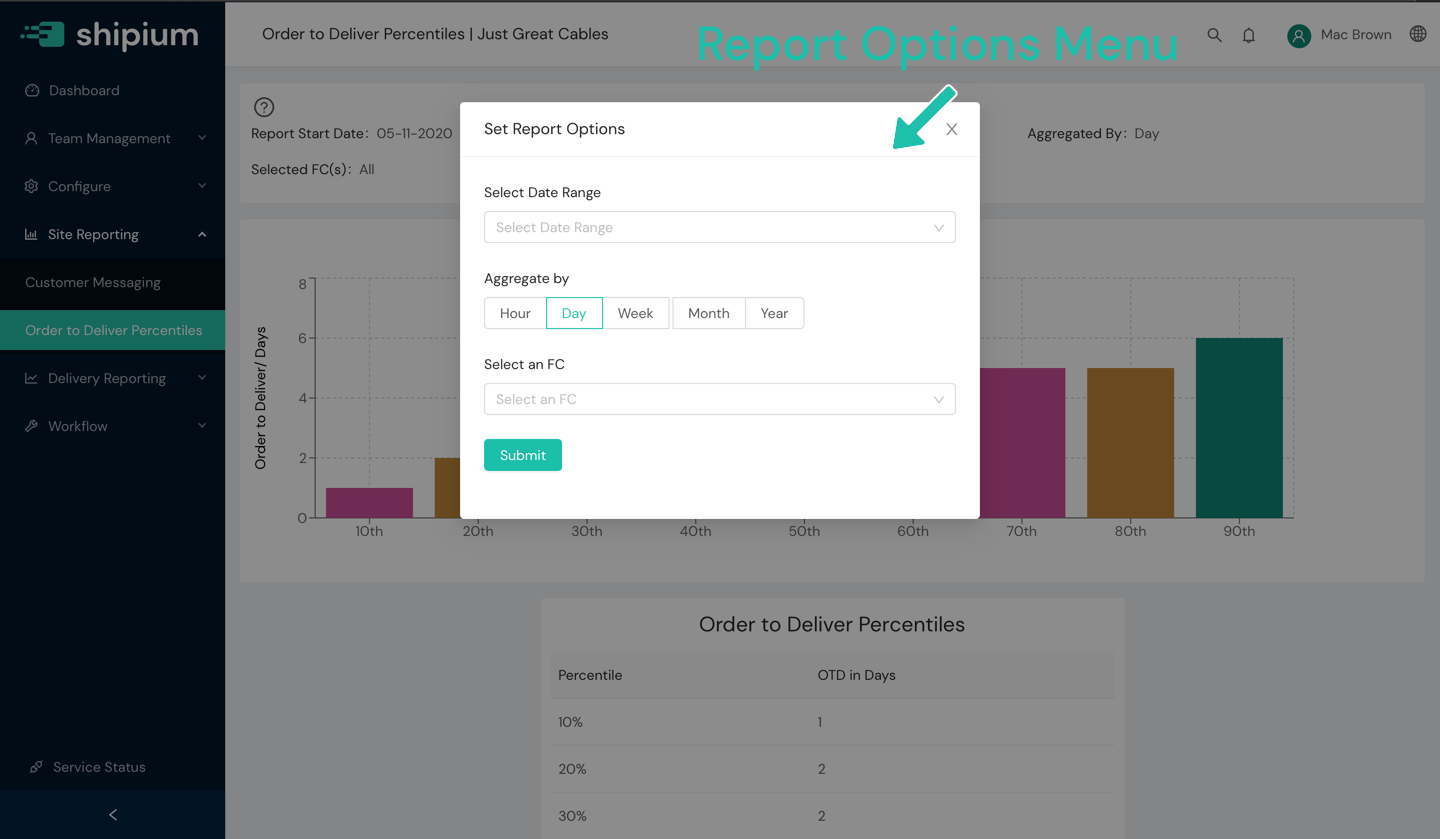
When you want to produce a report with a particular set of configuration values, you will start by clicking on the button labeled "Change Reporting Options", which will bring open a dialog as you see above, enabling you to set the options for this report.
Some common option types are described below.
Set a date range
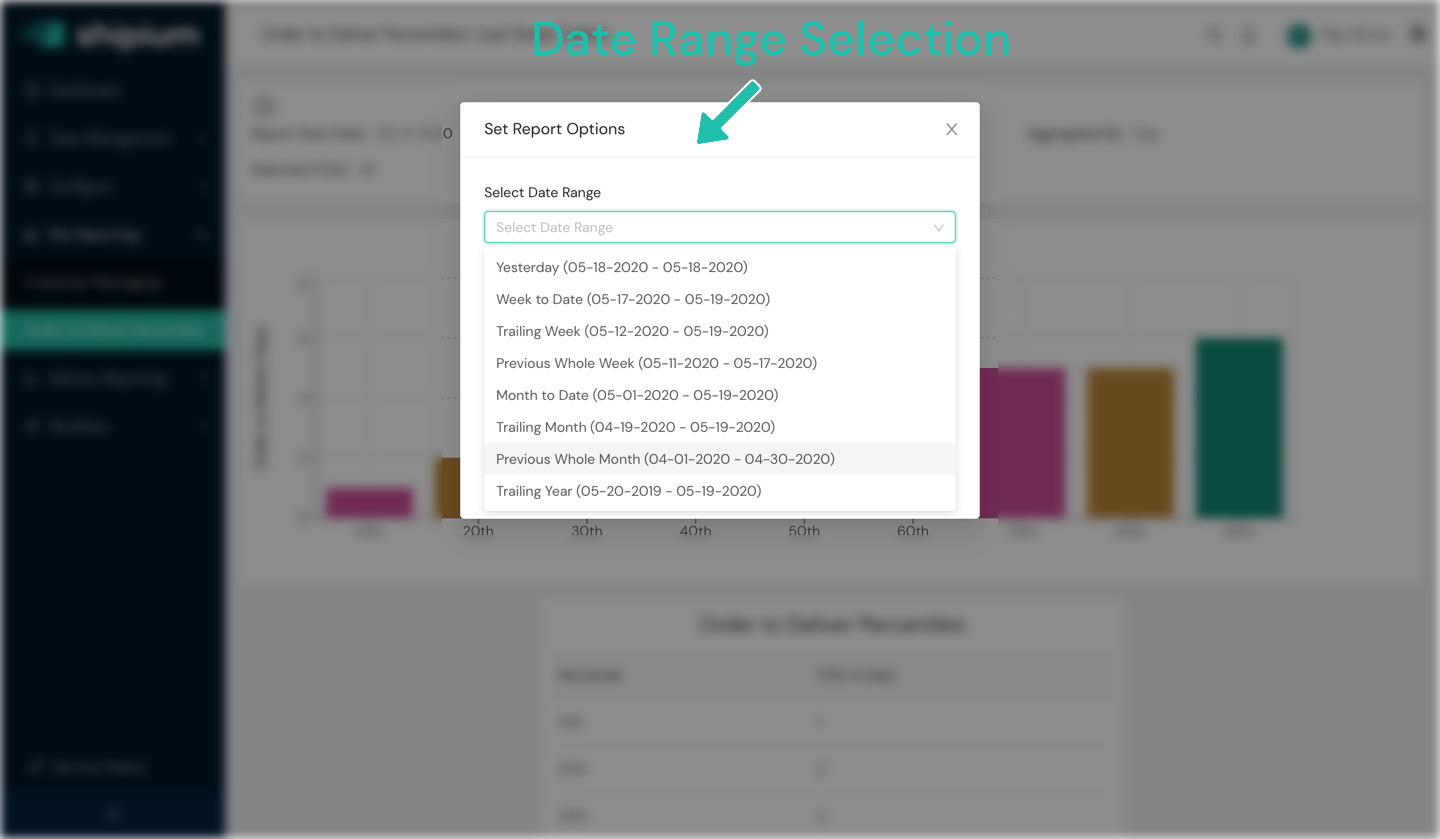
Almost any report is going to be relevant for a particular snapshot in time. This might be today so far, yesterday, the week to date, or any number of other potential options. Date range options generally break down into two broad categories: Pre-Defined and Custom. In most cases, you can just choose one of the pre-defined options for your use case.
However, if you scroll to the bottom of the Select Date Range menu, you will find an option titled "Custom Range". This option will let you choose a specific date range for those cases in which you need something other than the pre-defined options, such as when you are investigating a particular timeframe in the past.
Set aggregation level
Another common option that you can set for reports is defining the Aggregation Level.
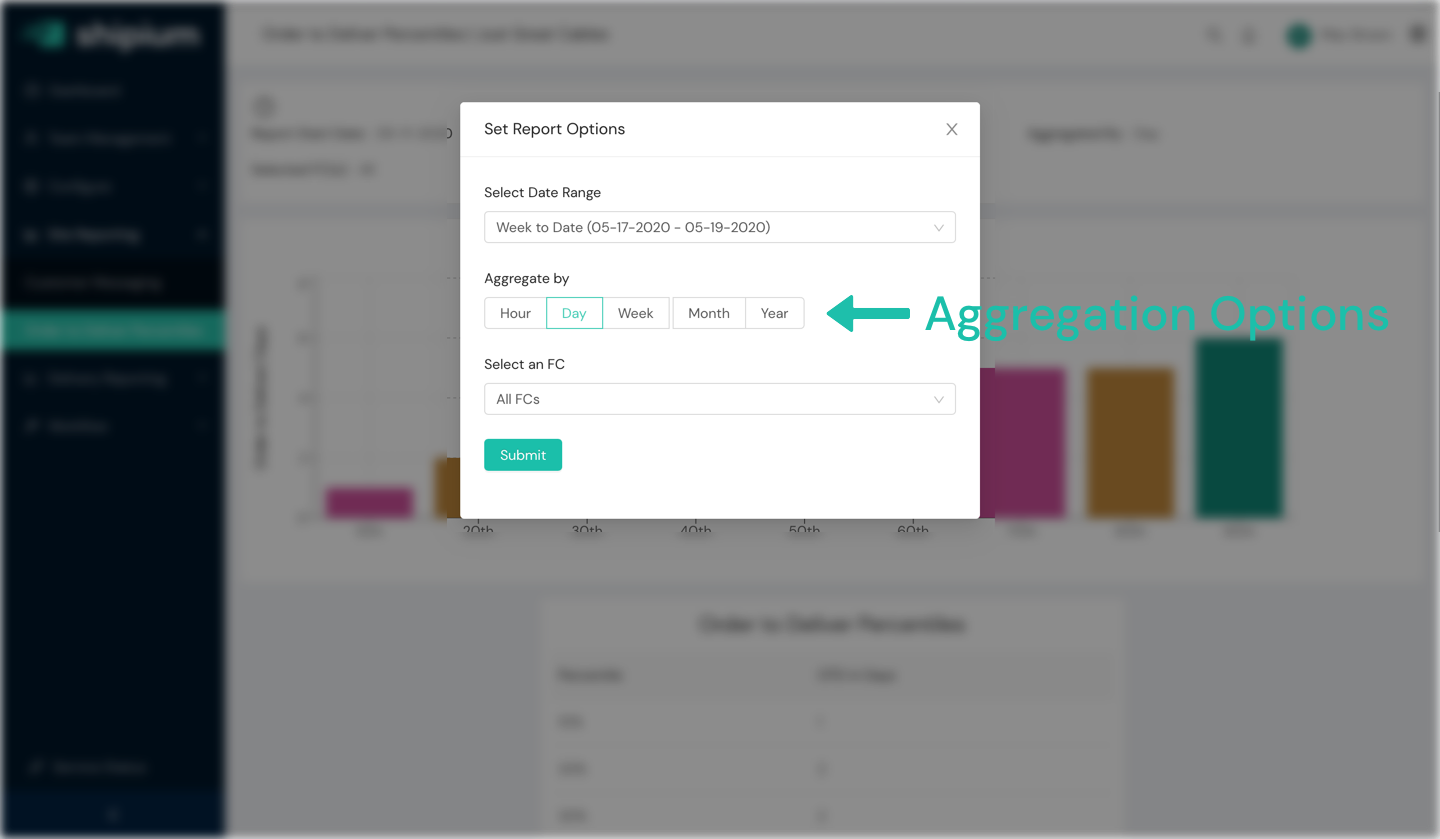
In short, what this means is defining how the data points in your report will be rolled up, such as one data point per day within your defined date range, or per week or per month. Aggregation level is where you will define the level of aggregation for line graphs, bar charts, and other point-per-time period chart types.
Set fulfillment centers
One final common way that you may want to filter your data is by fulfillment center.
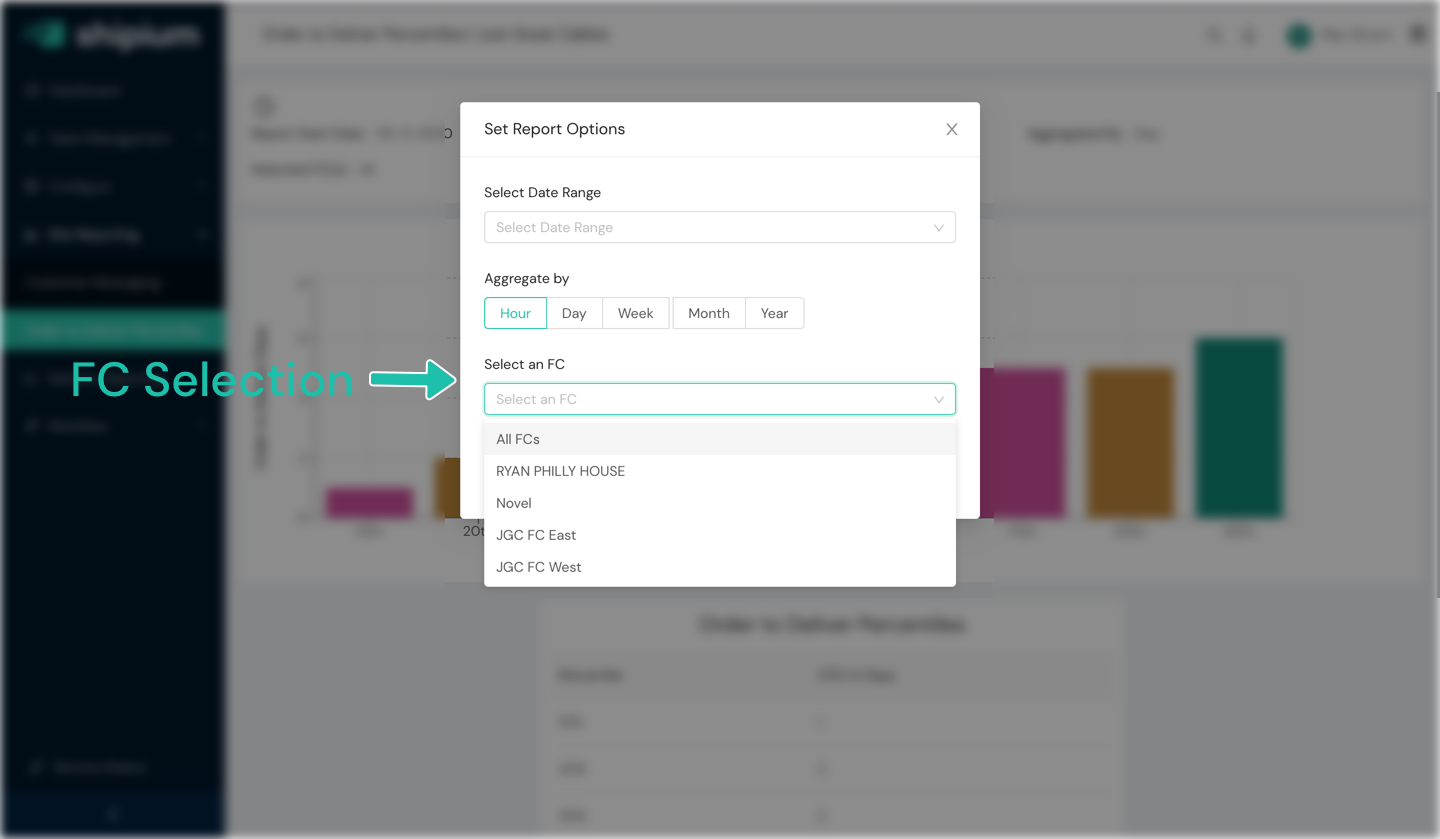
Perhaps you would like to look at the order-to-deliver performance for a particular warehouse in your network because you are trying to understand how each fulfillment center is performing. Or maybe you are investigating what appears to be a network-wide degradation for a particular metric and you are trying to determine if it was across all fulfillment centers or specific to a particular one – this filter will enable you to dig into that at the level you need.
Resources
Your Shipium team member is available to help along the way. However, you might find these resources helpful:
Updated 3 months ago
