
On-Time Performance Dashboards
View reports that measure actual delivery date performance against desired delivery date.
About the On-Time Performance dashboards
The On-Time Performance dashboards display on-time performance (OTP), measuring a shipment's delivery date against the desired delivery date (DDD) you provided for the shipment. It highlights the percentage of shipments delivered on or before the expected date, helping track service reliability and identify trends in meeting customer expectations. Key breakdowns include carriers, service methods, and locations. You can learn more about DDD in the Desired and Guaranteed Delivery Dates documentation.
There are two On-Time Performance dashboards:
- On-Time Performance | Desired Delivery Date. This dashboard displays the OTP, with breakdowns by origin, carrier, carrier type (national vs. regional), service method, and service method type (standard vs. expedited).
- On-Time Performance Data Export. This data table allows filtering by carrier, carrier type, carrier service method, service level type, origin state, destination state, and volume of labels generated. You can export filtered data to a CSV file.
Customer data securityWith Shipium’s reporting applications, you can count on your data being secure:
- Data encryption
- Compliance
- Access controls
- Security audits
This document provides an overview of the On-Time Performance dashboards, outlining their functionality, handling of data exceptions, and key definitions. You can refer to the Reporting Product Overview documentation for more general information on Shipium reporting and user roles.
Shipium also offers on-time delivery reporting through Shipium Orca AI Analytics. If you have access to Orca AI Analytics, see the On-Time Delivery Dashboard for that platform's reporting.
Access the On-Time Performance dashboards
To access any dashboard, you’ll need to log in to the application:
- Go to the Shipium-provided URL.
- Log in using your credentials: email, password, and a multi-factor authentication (via phone or email).
Next, you’ll navigate to the dashboard:
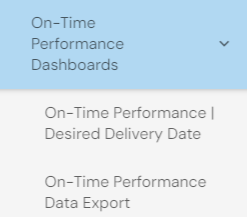
- After logging in, you’ll use the vertical menu on the left side of the screen.
- Go to the folder labeled “On-Time Performance Dashboards”. You’ll select any of the dashboards nested under this folder to view their particular content.
View On-Time Performance dashboards
This section includes instructions for each of the On-Time Performance dashboards as well as default settings, metrics, and data nuances for these reports.
Filters for each dashboard are defined in the following table.
| Filter name | Description |
|---|---|
| Carrier ID | Name of the shipping carrier for which the label was priced (e.g., USPS, UPS, FedEx) |
| Carrier Type | Categorization of carriers as national (serving across the country) or regional (operating in specific regions) |
| Carrier Service Method | The shipping method offered by the carrier (e.g., overnight, ground) |
| Service Level Type | A classification of service methods: Expedited (3 days or less) or Standard (domestic, 4+ days) |
| Origin State | The state from which the shipment will be sent (e.g., warehouse, fulfillment center, store) |
| Destination State | The state to which the shipment is sent (e.g., customer’s residence) |
| On-Time Performance | Percentage of shipments with a desired delivery date (DDD) provided that were delivered on or before that date |
| Desired Delivery Date | The desired date on which the package should be delivered, configured by your organization |
On-Time Performance | Desired Delivery Date
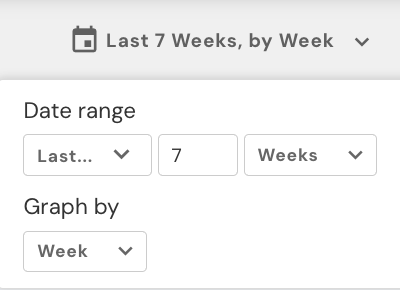
While the default setting is a label creation period of the last seven weeks, grouped by week, you can adjust the dates in the top-right corner and apply filters across the top of the dashboard.

For each filter, this dashboard provides the following reports:
- Percent of Shipments with DDD
- Percent of Shipments with DDD Over Time
- On-Time Performance Total
- On-Time Performance Over Time
- On-Time Performance by Carrier
- On-Time Performance by Carrier Over Time
- On-Time Performance by Carrier Service Method
- On-Time Performance by Carrier Service Method Over Time
- On-Time Performance by Origin
- On-Time Performance by Origin Over Time
- On-Time Performance by Carrier Type
- On-Time Performance by Carrier Type Over Time
- On-Time Performance by Service Level
- On-Time Performance by Service Level Over Time
You can also click on specific visuals (e.g., On-Time Performance by Carrier Service Method Over Time) to filter the rest of the dashboard accordingly. For each filter, this dashboard provides the on-time performance over time.
On-Time Performance Data Export
As with the On-Time Performance | Desired Delivery Date Dashboard, you can adjust the reporting dates in the top-right corner and apply filters via the drop-downs across the top of the dashboard.
Then you can export the data table as a CSV or Excel file, with the following restrictions:
- The reporting application only supports exporting one million rows at a time.
- Data is not available at the shipment ID level.
Default settings
Each dashboard defaults to a label creation period of the last seven weeks, grouped by week. You can adjust the time period filter for any period after 1/1/2023.
Other filters available include carrier, carrier type, carrier service method, service level type, origin state, and destination state.
Metrics
The following metrics are provided for the On-Time Performance dashboards:
- On-Time Performance. Calculated as the percentage of shipments that were delivered on or before the desired delivery date
- Label volume. The count of labels generated
Data nuances
The following data nuances apply to the On-Time Performance dashboards:
- All dashboards are based on the label creation date.
- Only shipments with a desired delivery date provided by your organization are included in the OTP calculation.
Resources
For assistance, reach out to your Customer Success Manager. Response times are typically within 2 to 5 business days.
Updated 4 months ago