
Shipium Orca AI Personal Metrics
Save and share custom metrics and graphs with other users in your organization.
About Orca AI Personal Metrics
Shipium's analytics dashboards are designed to answer common questions about your operations, but every business has unique needs. Personal Metrics gives you a space to save custom views — whether you've modified an existing dashboard metric or created something new with the Orca AI Agent — so you can quickly access and share the data that matters most to your team.
Create custom metrics
You can create custom metrics in two ways. Start from an existing dashboard metric when you want to pin a view as-is or make modifications to something close to what you need. Use the Orca AI Agent when you want to generate a new visualization from a prompt.
Start from a dashboard metric
The quickest way to build Personal Metrics is to start from an existing dashboard metric. You can pin a metric as-is to consolidate views from multiple dashboards in one place, or modify a metric first and then save your customized version.
Copy an existing metric directly to personal metrics
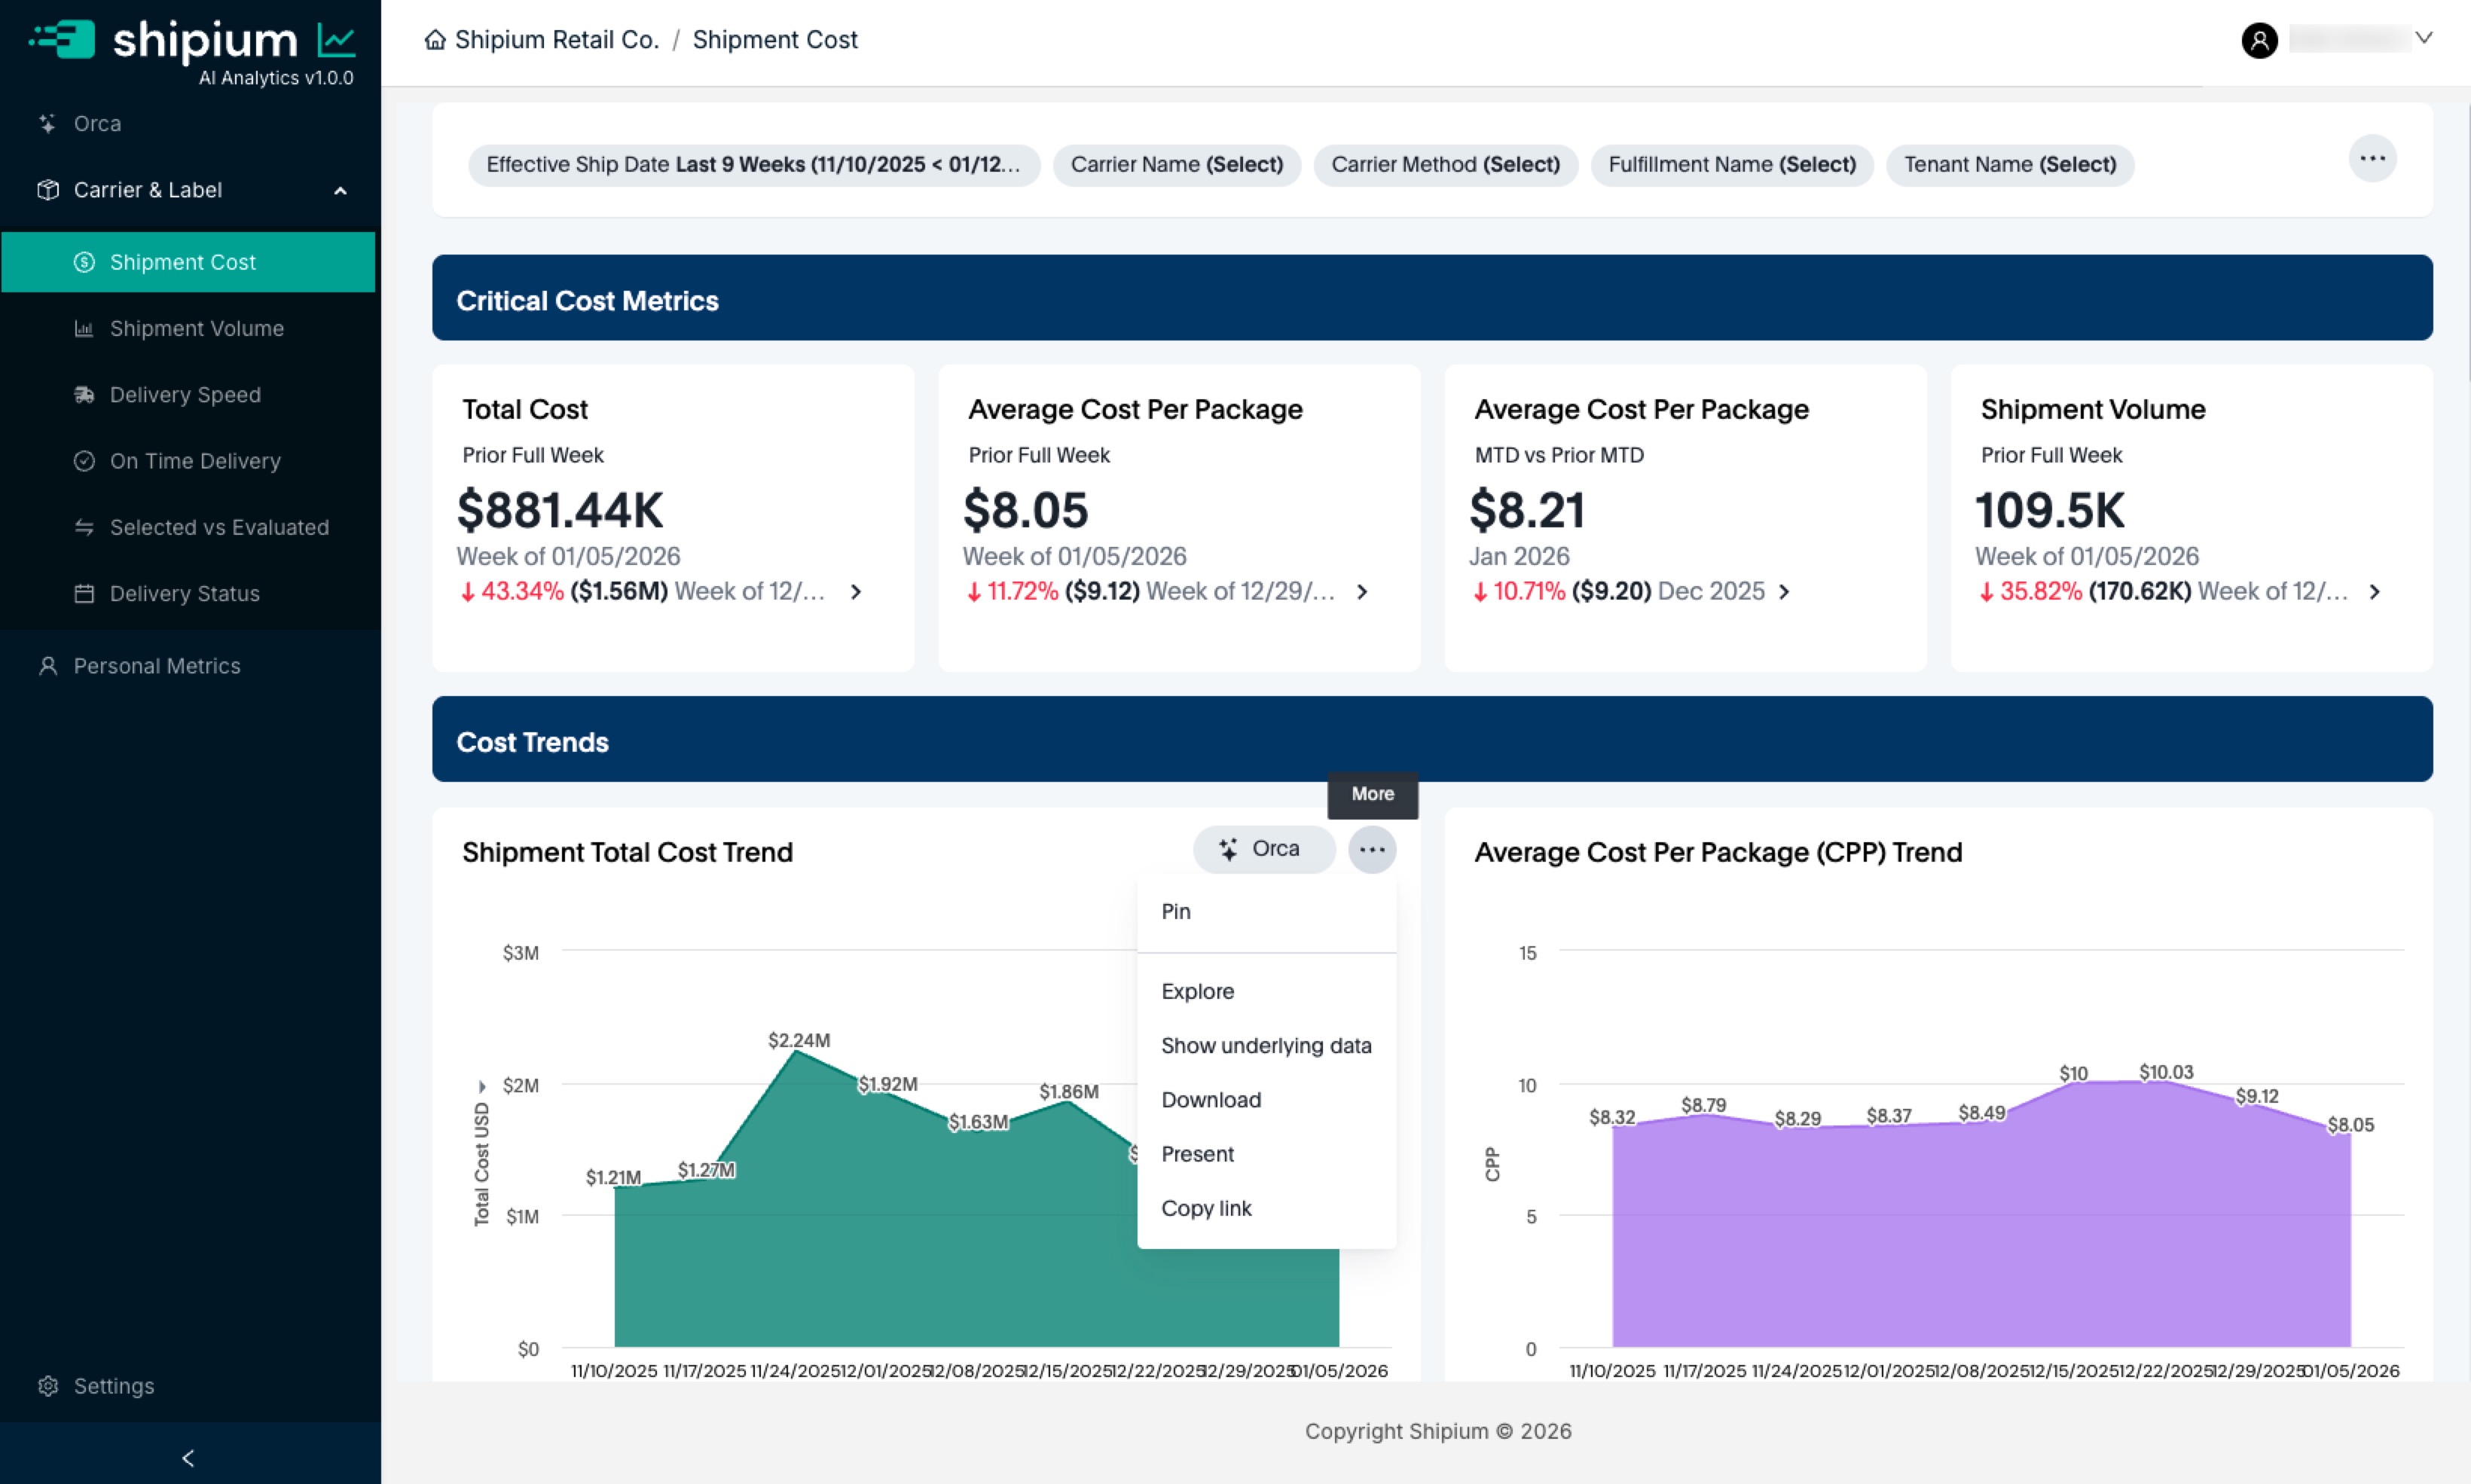
This is the easiest option for adding a metric to your dashboard. To save an existing metric without changes, hover over the metric to reveal the ... menu, then click Pin.
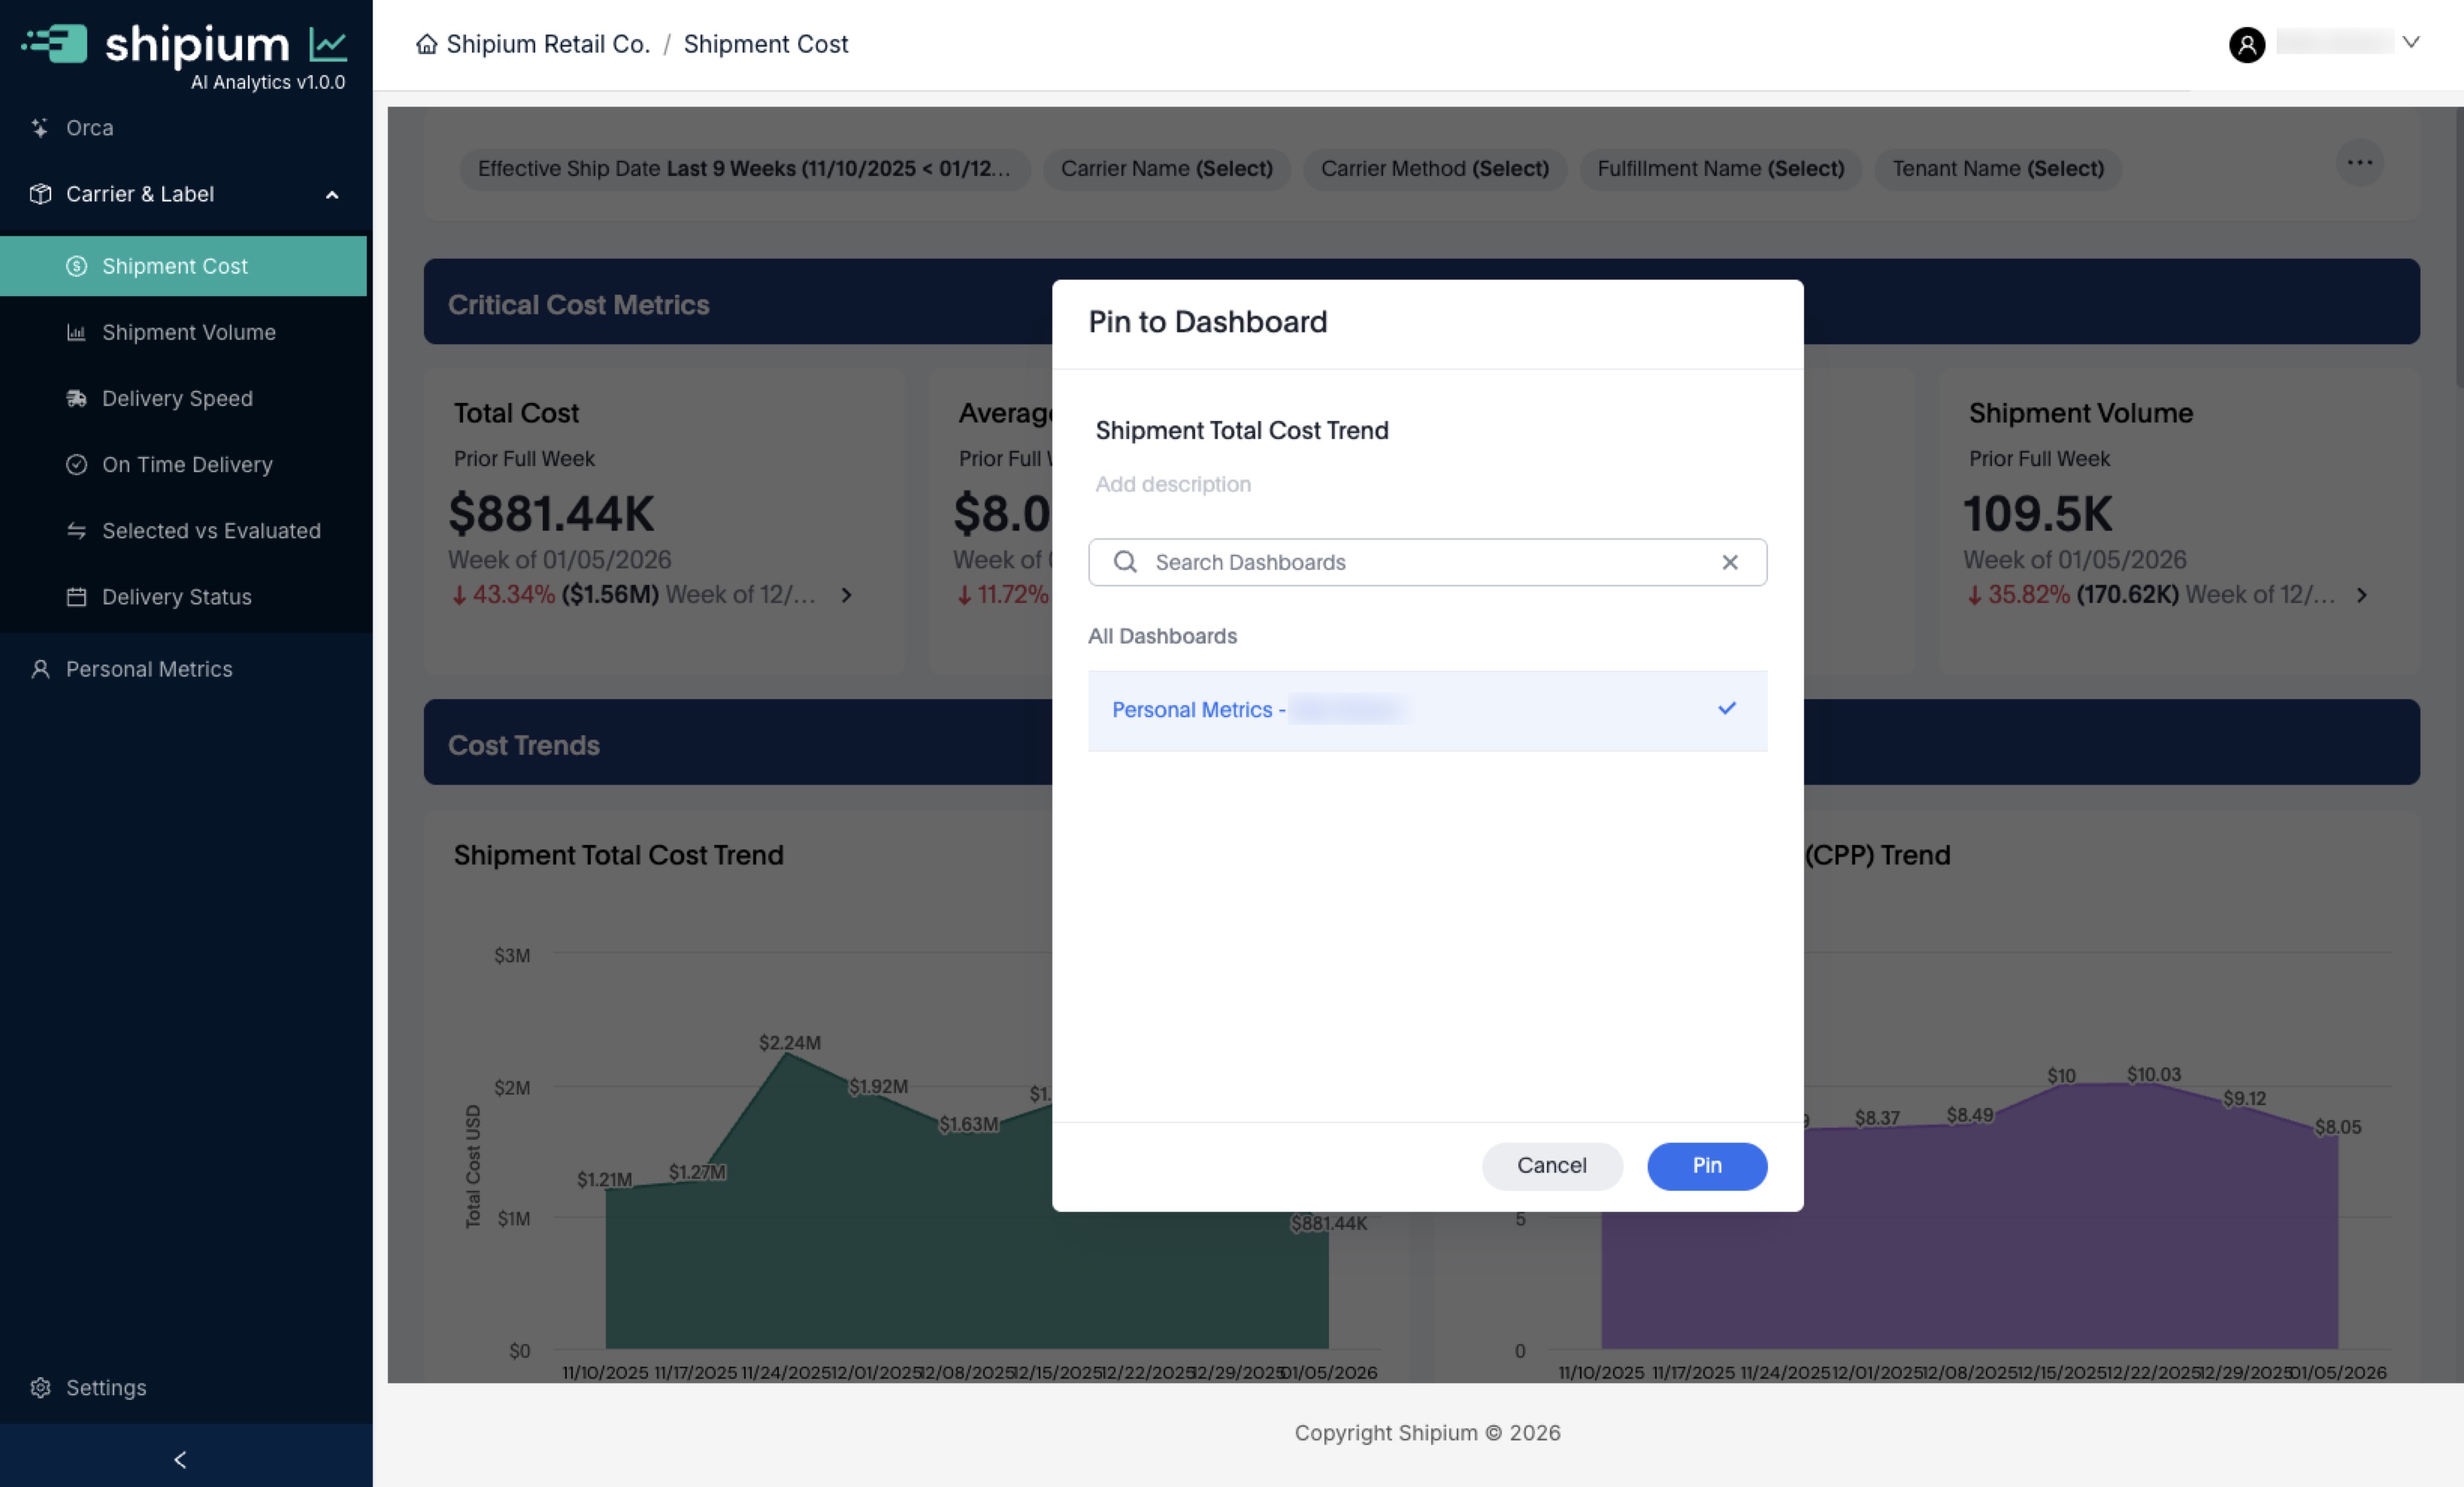
Clicking Pin brings up the option to pin it to your Personal Metrics.
- Click Pin from the
...menu. - Click on Personal Metrics - [Your Name] to select your Personal Metrics dashboard.
- Click the Pin button in the bottom right.
- Now the metric will be added to your Personal Metrics.
Change an existing metric and add it to Personal Metrics
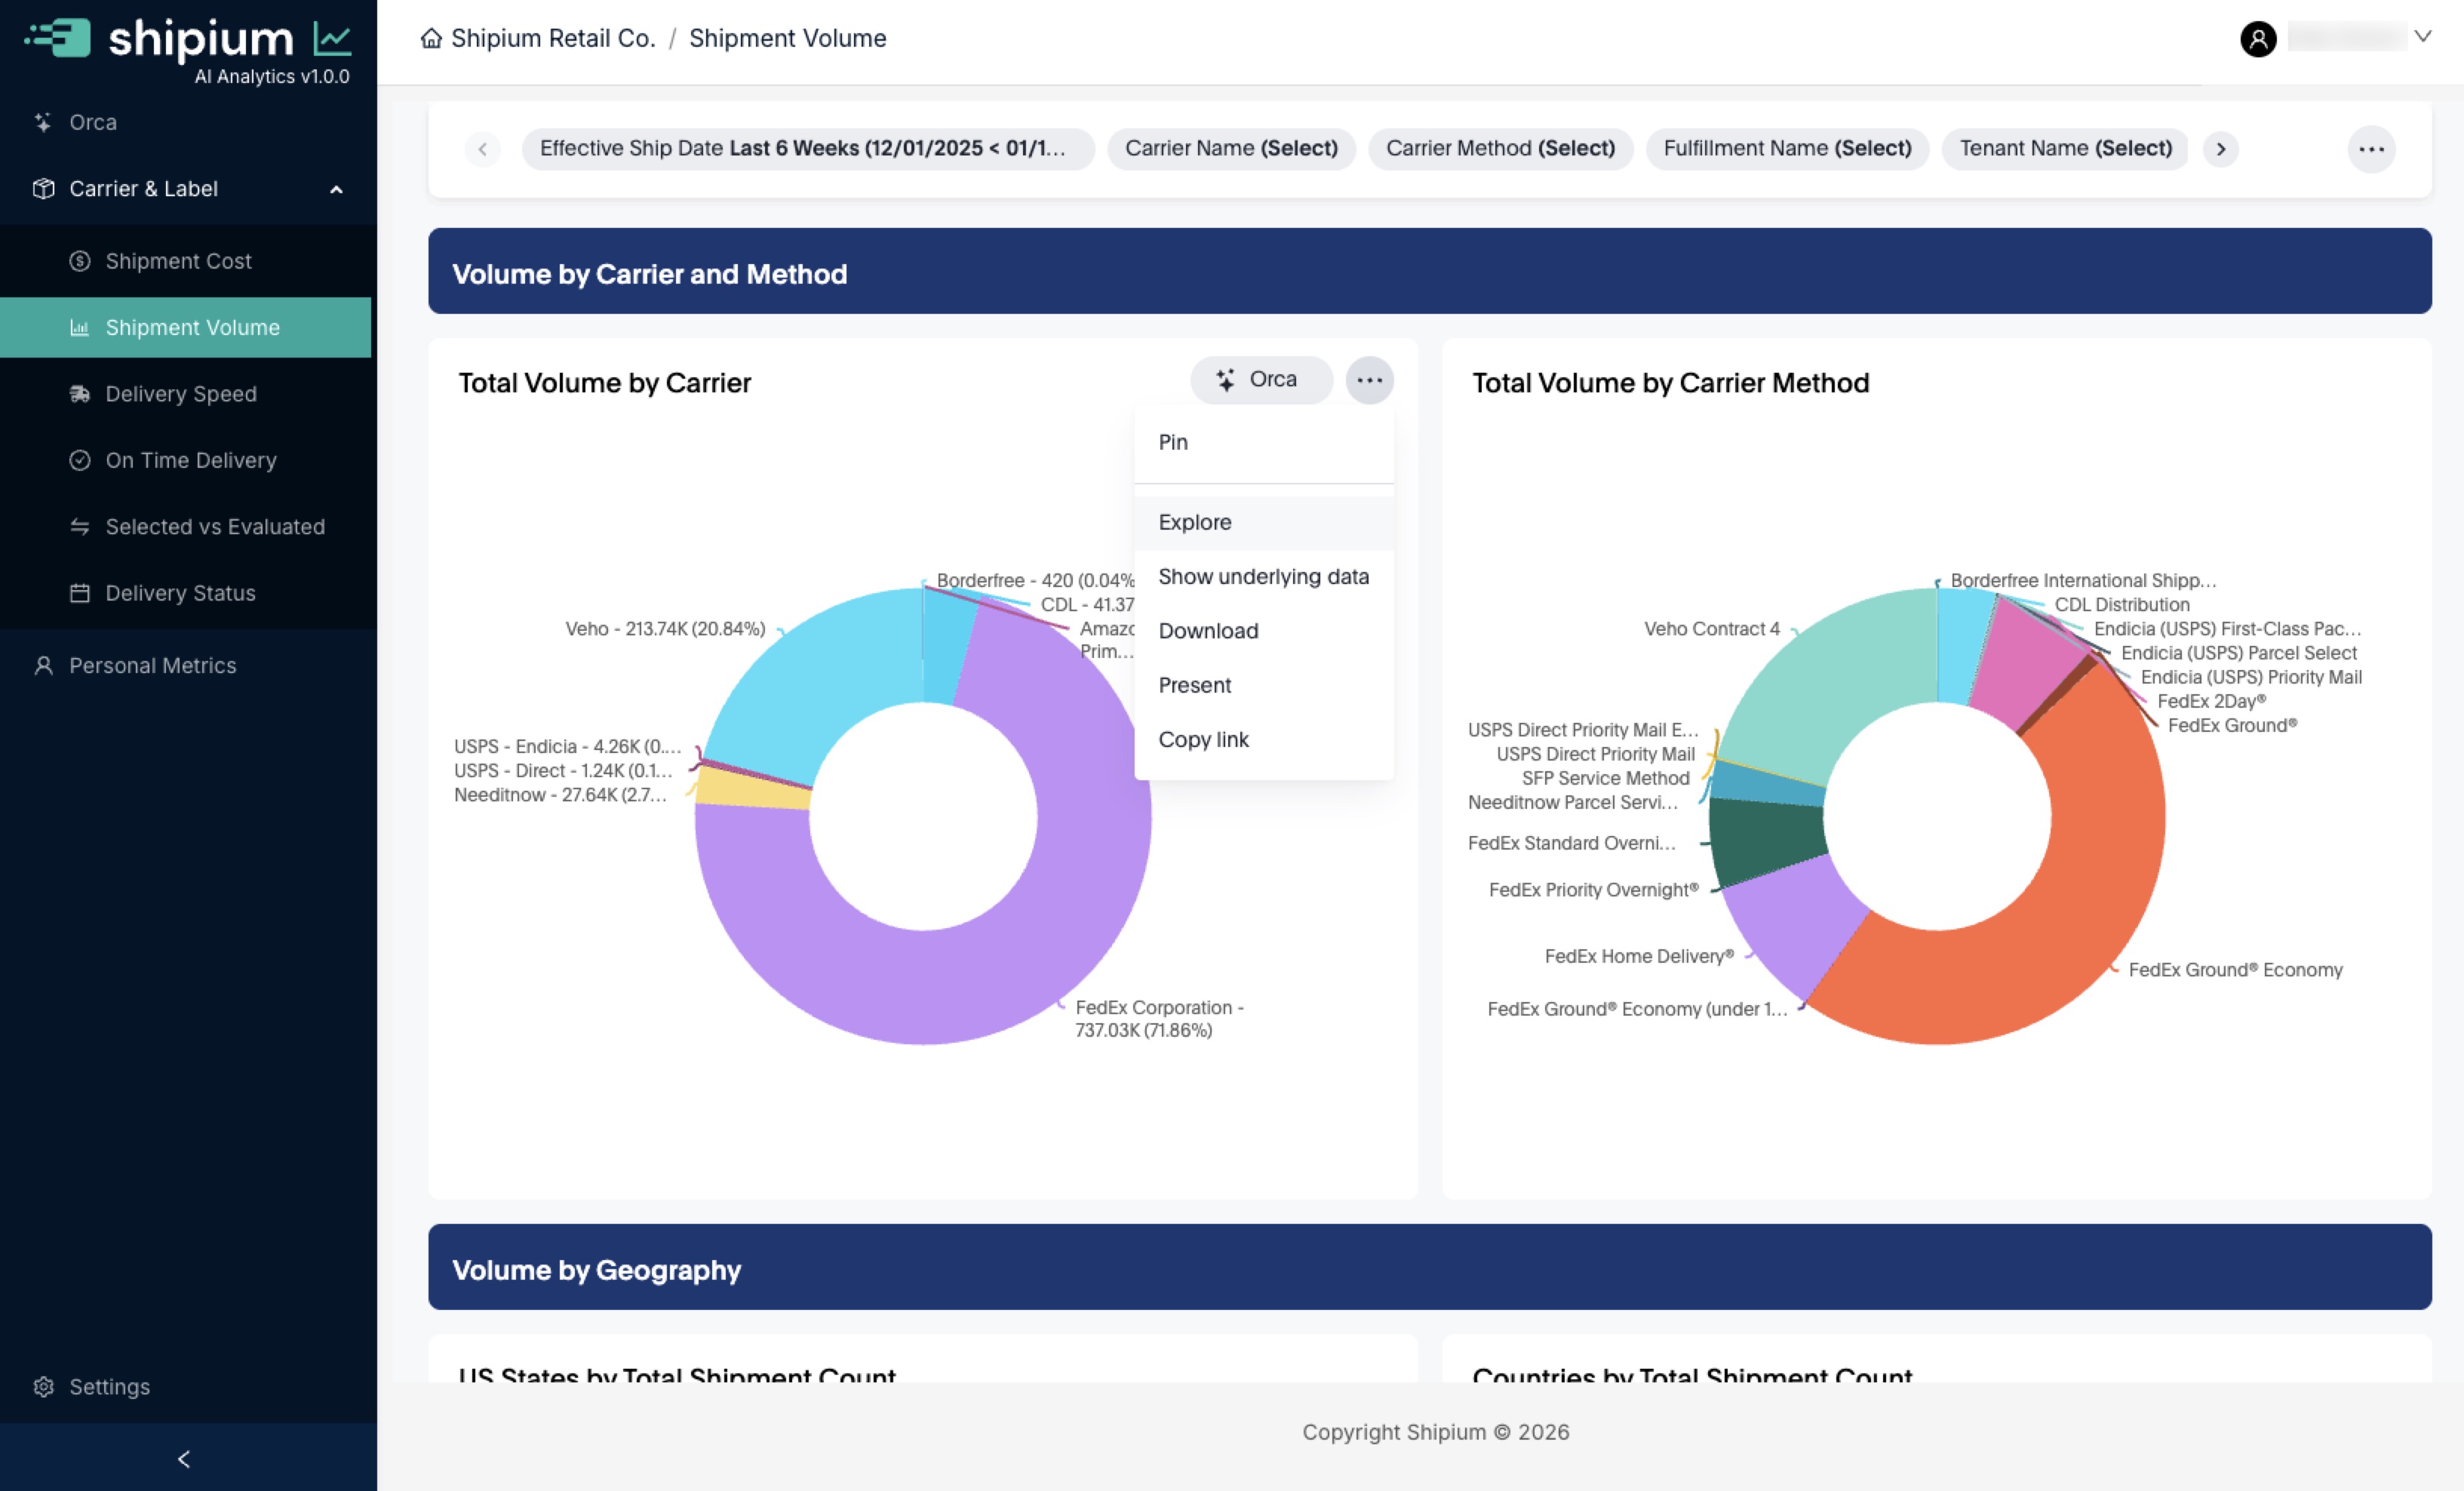
Sometimes an existing metric is close to what you need, but with a different breakdown or data slice. In that case, click the ... menu on the metric and select Explore to customize it.
For example, you could start by clicking on the ... on the "Total Volume by Carrier" metric.
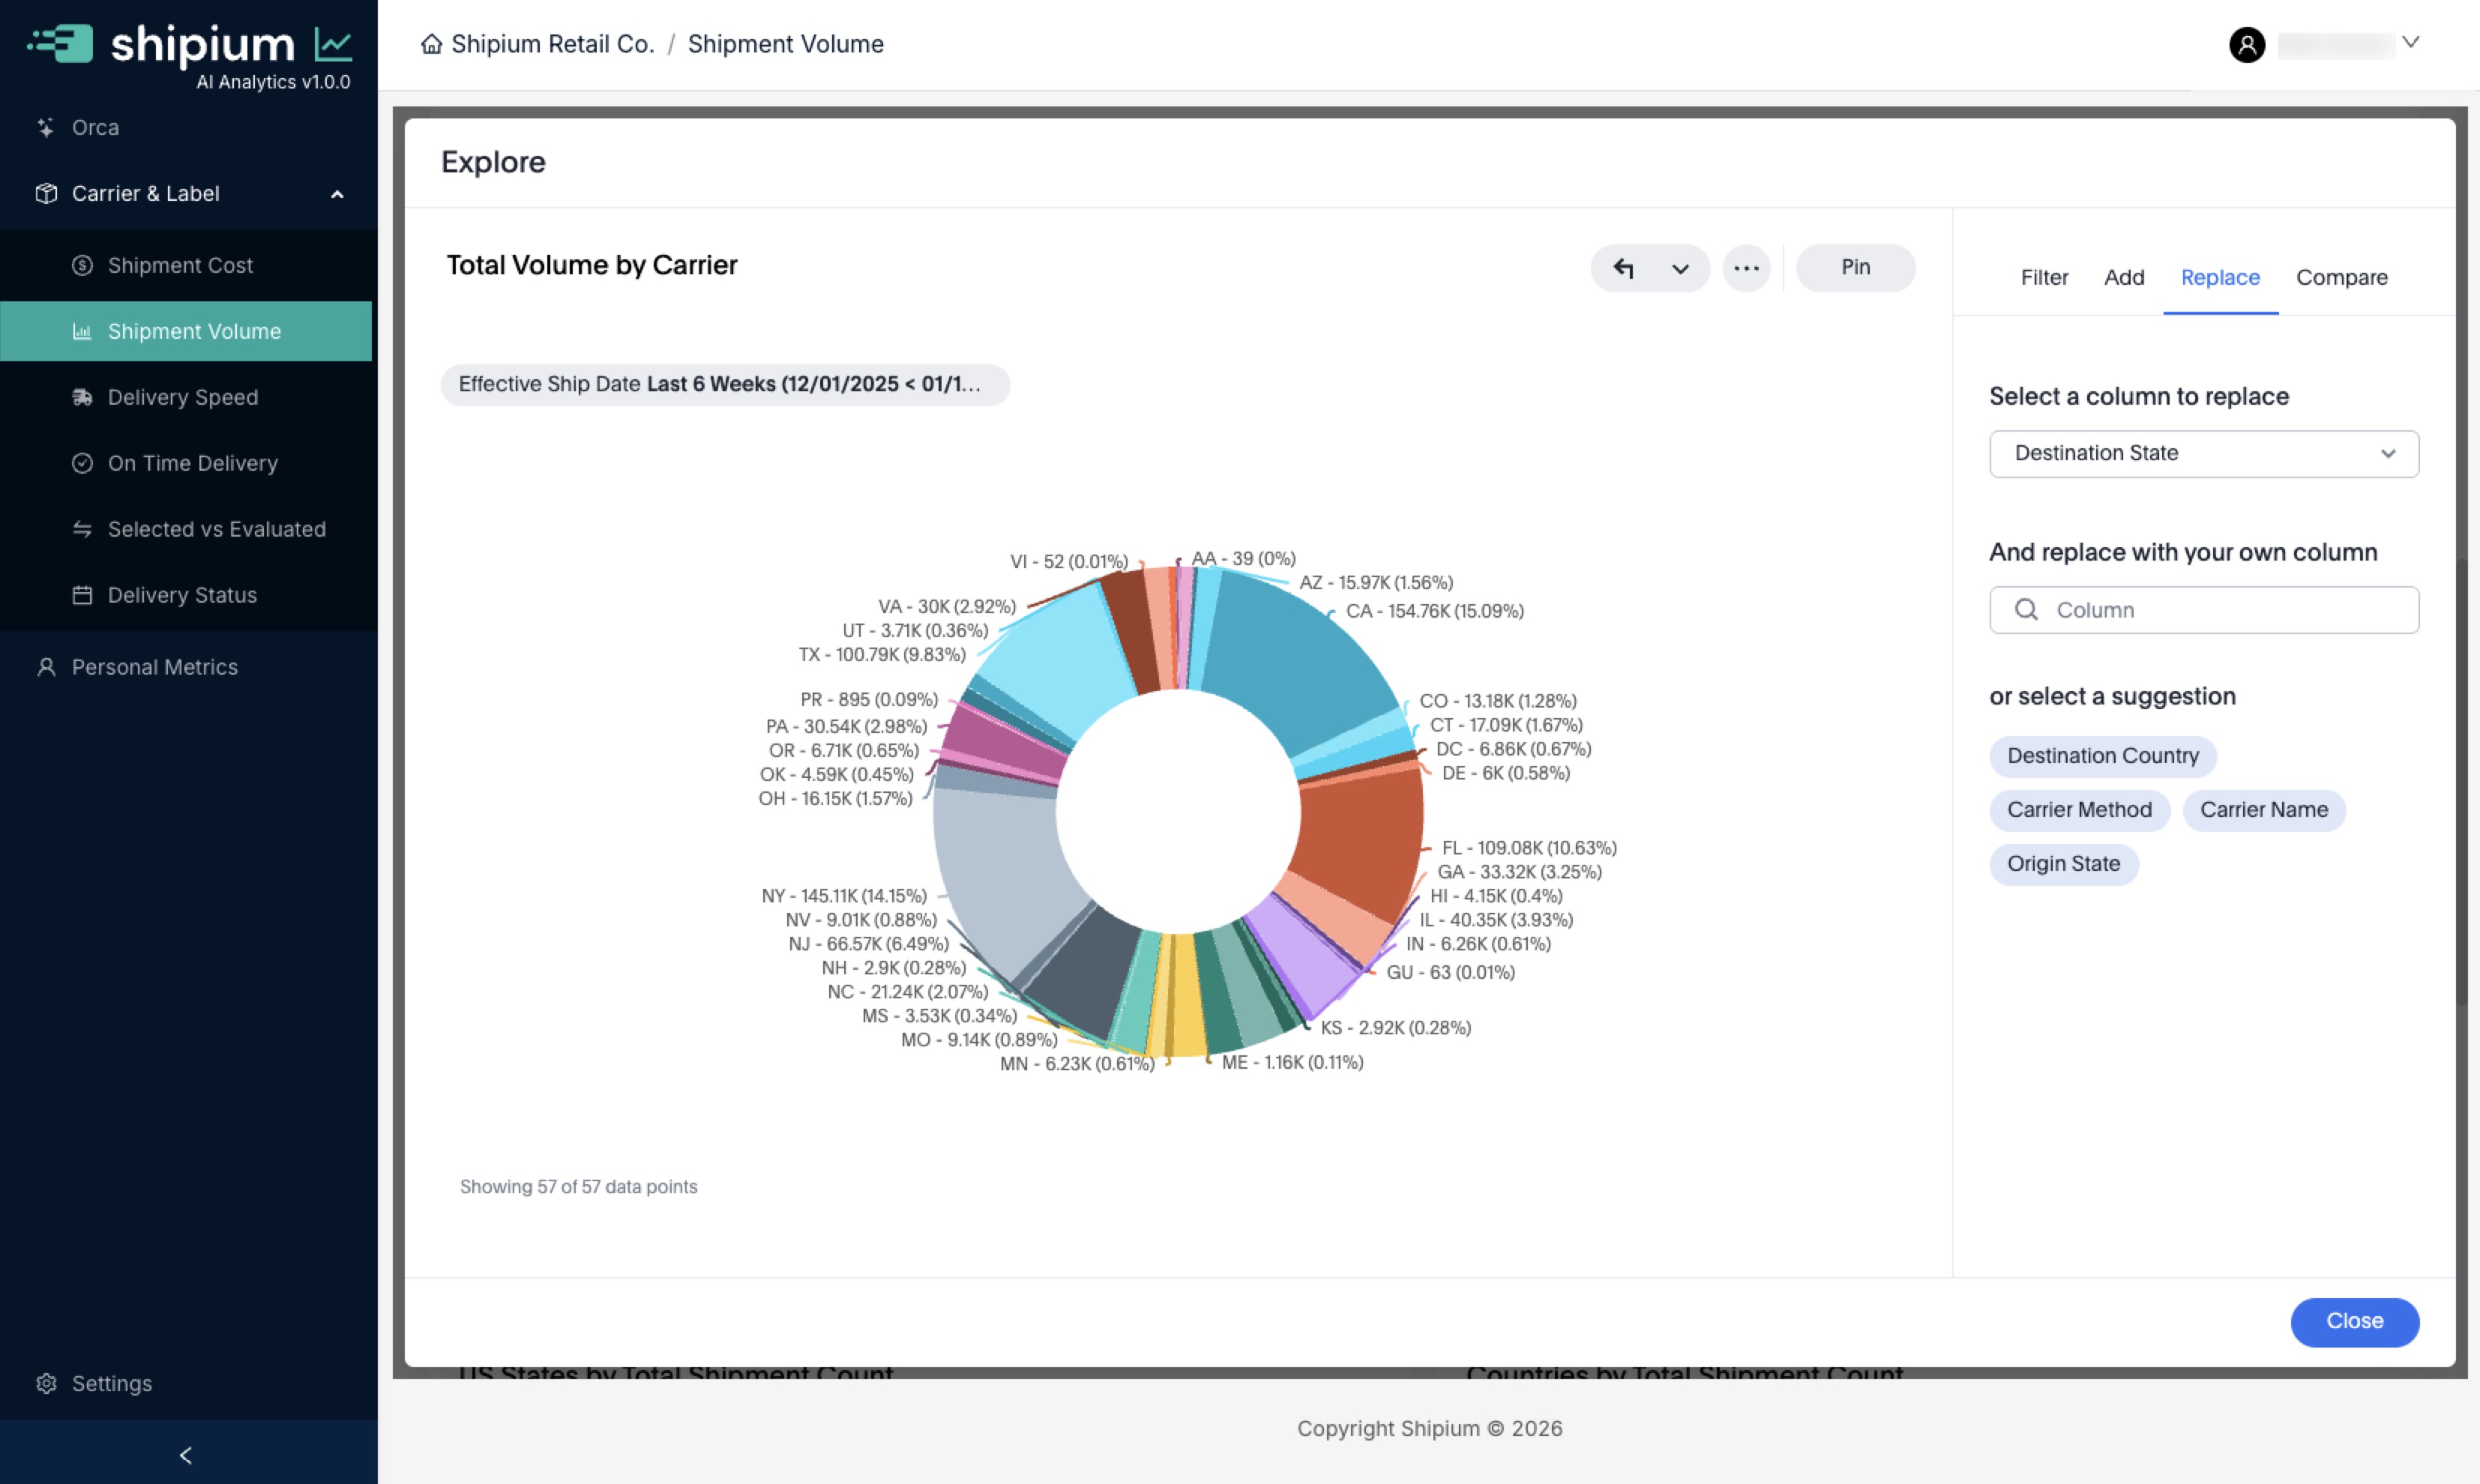
Within Explore mode, you can change how information is being broken down. Instead of a breakdown by carrier, you could look at the breakdown by Destination State.
- Click on Replace in the top-right of the screen, to replace Carrier Name with Destination State in the metric.
- Select "Carrier Name" in the list under Select a column to replace, since that is the breakdown that you are changing.
- In the And replace with your own column, you can either choose from the list that comes up when you click or start typing "Destination State" to find it. (Searching starts to filter the list to appropriate candidates.)
- Select "Destination State" and you will see the metric update with the new breakdown (shown below).
If you want to save the metric to your Personal Metrics, that can be easily accomplished in a few steps:
- Click on Pin.
- Select Personal Metrics - [Your Name] as in other examples.
- Click the Pin button in the bottom right.
- Now the new custom metric that you have created will appear in your Personal Metrics.
Start with the Shipium Orca AI Agent
Similar to the example above for starting with an existing dashboard metric, this section includes an example starting with the Shipium Orca AI Agent via Orca Chat.
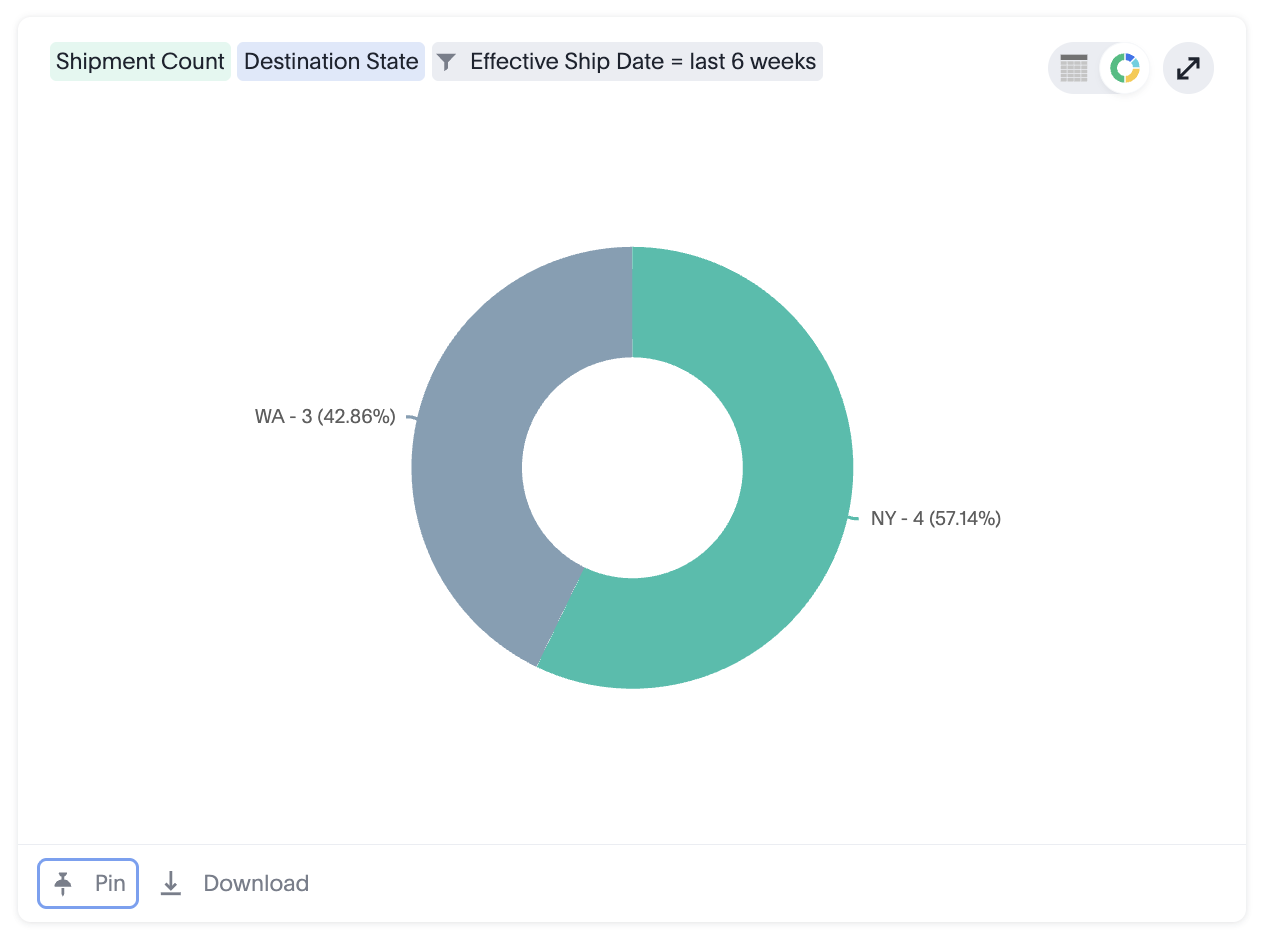
You'll begin with a prompt. In this example, the prompt will produce a similar graph as the one in the previous example.
Create a ring chart of shipment volume broken down by destination state for the past 6 weeksIn the bottom left of the graphic created, you'll see a Pin icon.
Selecting the Pin button brings up the screen that allows you to save this metric to your Personal Metrics.
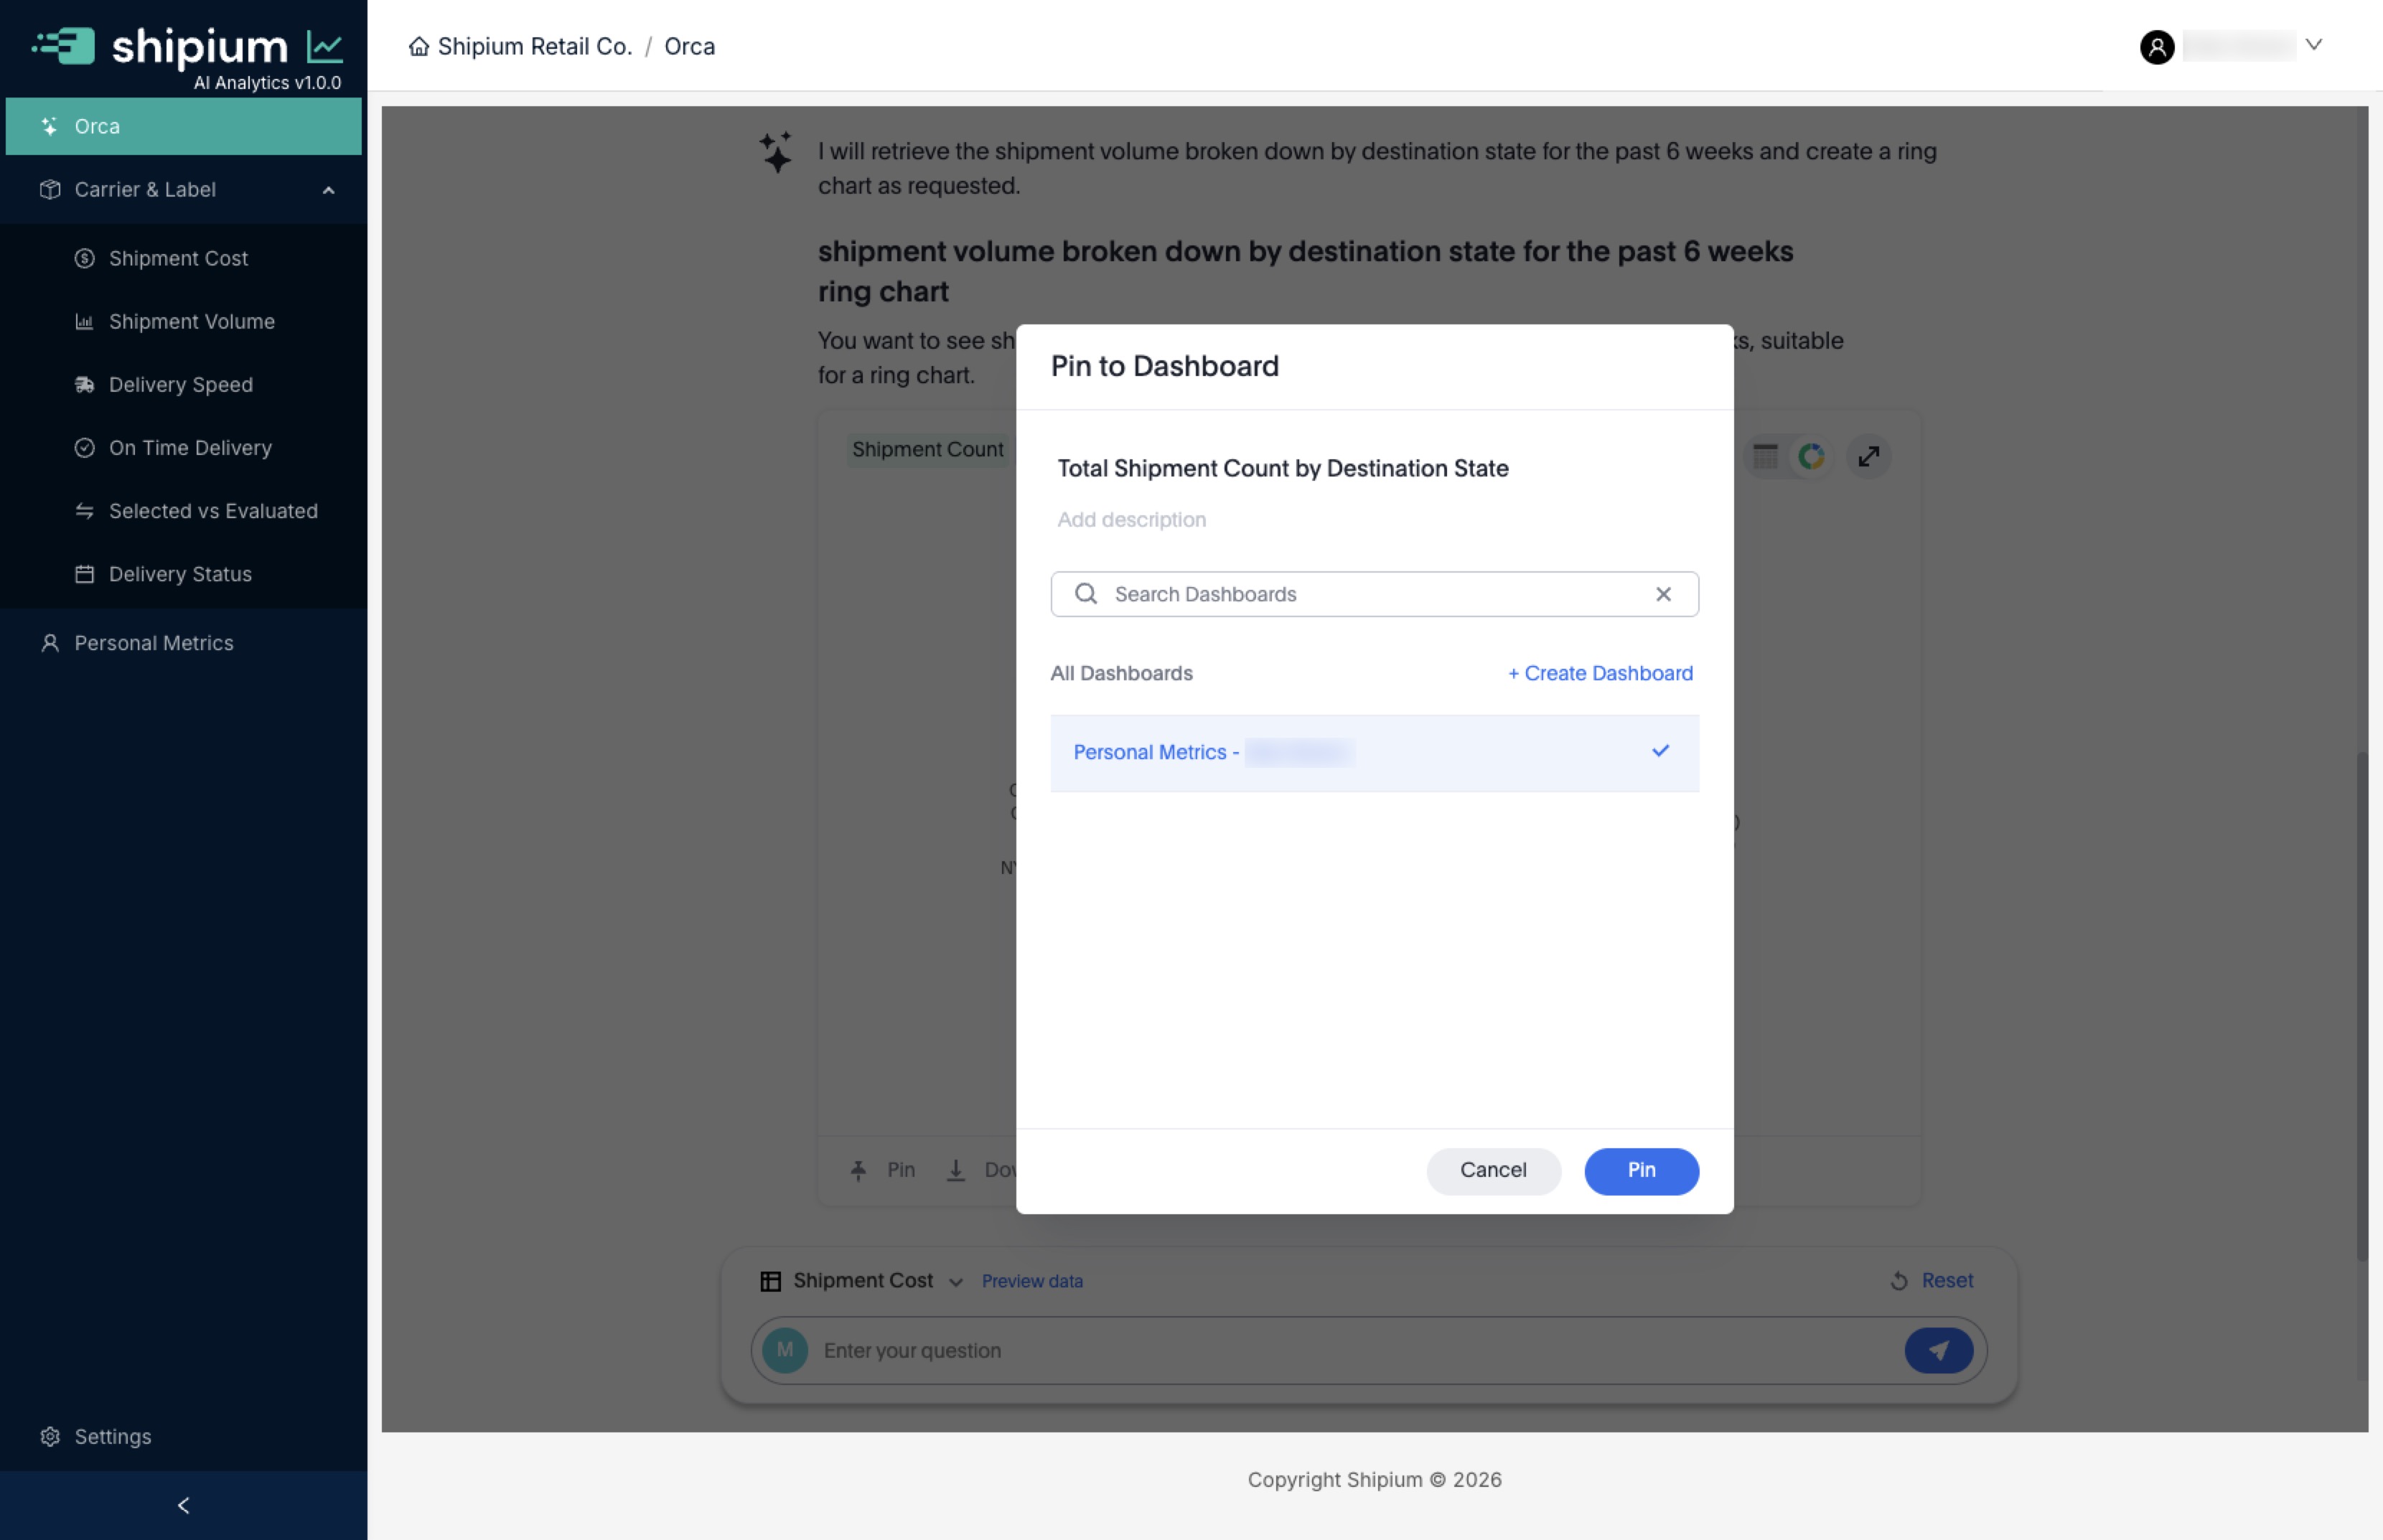
Pin to Dashboard prompt in Orca Chat
Manage your Personal Metrics layout
The following examples assume that you have already used one of the above methods to add two metrics to your Personal Metrics board as you see in the following base setup. Two metrics have been added: "Shipment Total Cost Trend" and "Total Shipment Count by Destination State".
The ... menu provides the normal dashboard controls, such as Download PDF or Present as discussed in Shipium Orca AI Analytics Dashboards. The Edit button allows you to change your Personal Metrics layout and filters and add notes or headers to help contextualize your data.
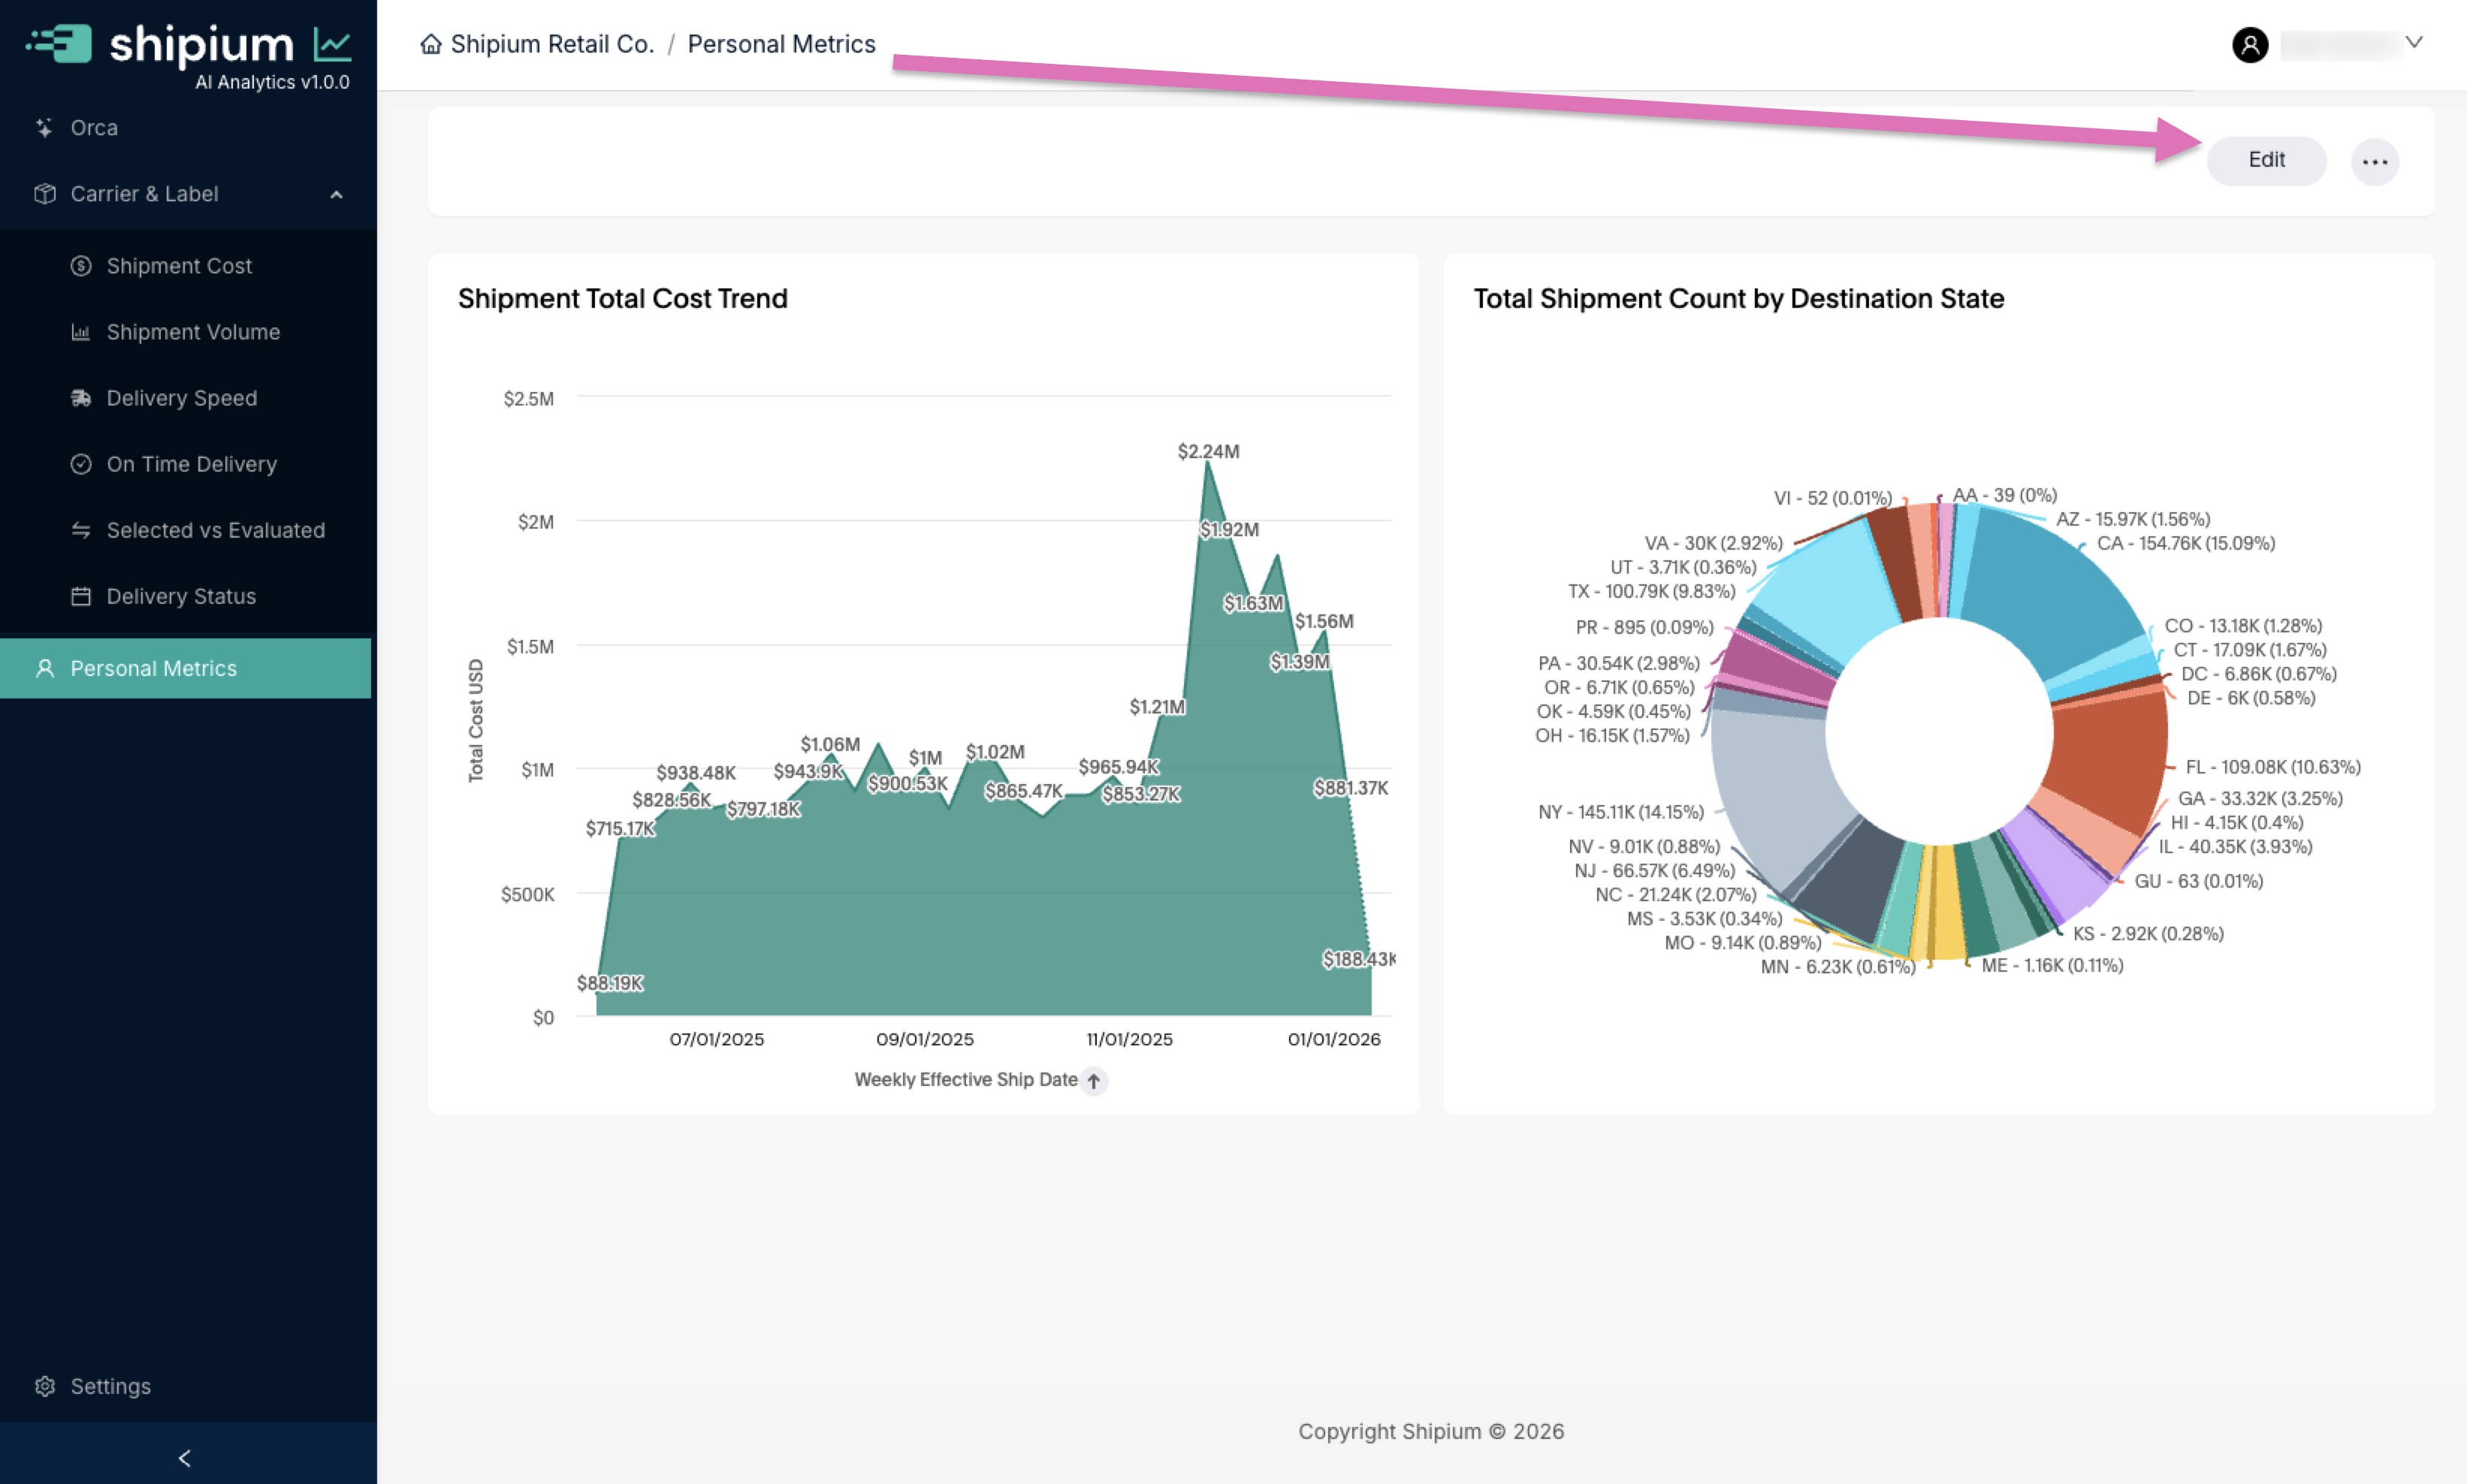
Unedited personal metrics board
Personal Metrics controls
When you click the Edit button in the Personal Metrics page, you'll see the following options at the top of your screen.

An overview of each element is described in the following table. Additional details for Add tab*, Add note, and Add filter are provided below.
Personal Metrics controls
| Number | Element | Description |
|---|---|---|
| 1 | Add tab | Add tab allows you to add an additional tab to the Personal Metrics section, almost like a way to create smaller pages within this page. This is one potential way of managing content if you have a lot of custom metrics that you want to have on your Personal Metrics. See below for details. |
| 2 | Add note | There are two different ways to use the Note feature. The first is if you want to add some context for a metric, you can add text and move it above or below the metric in question. Another way to use the Note is to create headers for sections and organize items below them. See below for details. |
| 3 | Add filter | Adding a Filter to your Personal Metrics enables you to change the settings for the metrics being displayed. We recommend at least adding Effective Ship Date or other relevant date fields so you can look at a particular date-bounded subset of your data. See below for details. |
| 5 | Cancel | The Cancel button will exit out of the Personal Metrics edit mode. |
| 6 | Save | The Save button will save any changes you have made to your Personal Metrics page. |
Add a tab to your Personal Metrics
Tabs allow you to create additional dashboards within your dashboard space. Each tab can contain its own set of metrics and be viewed without seeing the contents of any other tab. As you create more metrics and add them to your Personal Metrics dashboard, you may decide that this additional level of organization would be helpful. Details for adding and managing tab contents follow.
Add a tab
This is the easiest part. When you click Add tab, a new tab will automatically be added and the first one will contain everything that is in your current dashboard. When in viewing mode, clicking on a tab will show the set of metrics contained within.
Edit tabs
When you are in Edit mode, you'll be able to click a 🔽 down chevron next to the tab name that gives you two options: Rename and Delete.
- Rename. You can give the tab a new more useful name that reflects what you're organizing within it.
- Delete. The delete option works differently based on its current contents. If there is nothing currently in the tab, it will be immediately deleted. If there are one or more metrics within the tab, then you'll receive a notification that any metrics contained within the tab will be deleted when the tab is. If this is not your intention, you should use the instructions just below to move the metrics you want to keep to another tab.
Move metrics between tabs
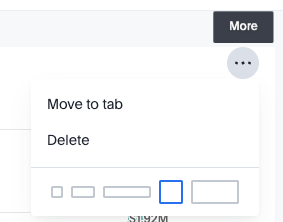
Once there is more than one tab, while you are in Edit mode in your Personal Metrics section, there will be a new option in the ... menu that allows you to change the tab that a given metric is in. Clicking Move to tab brings up a list of the current tabs; selecting one will move that metric. By default, moved metrics will appear at the bottom of the tab to which they are added.
Add a note to your Personal Metrics
When you click on 📄 Add note, you will see the following interface appear for populating your new note. By default, notes are created with a heading section and a body section, but these can be changed. Using the + Insert dropdown will also give you options for adding images, tables, or dividers.
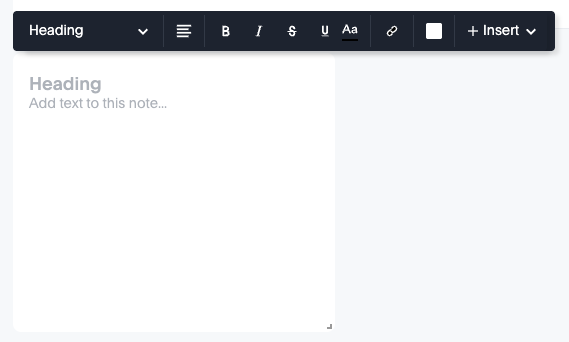
You can also change the color of the note and resize using the bottom-right corner.
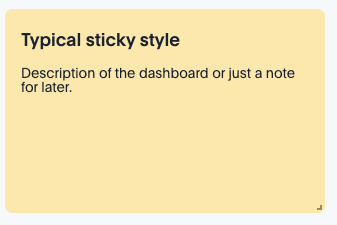
Sample note after editing
Like metrics and other elements on the Personal Metrics dashboard, the notes can be resized and moved as needed.
Add a filter to your Personal Metrics
Adding a Filter to your Personal Metrics enables you to change the settings for the metrics being displayed. While you can add as many filters as you want to the Personal Metrics board, each with its own default, we recommend at least adding Effective Ship Date or other relevant date fields so you can look at a particular date-bounded subset of your data.
The following example adds Effective Ship Date to your Personal Metrics dashboard:
-
Click on Add Filter, which brings up the available filters for that metric.
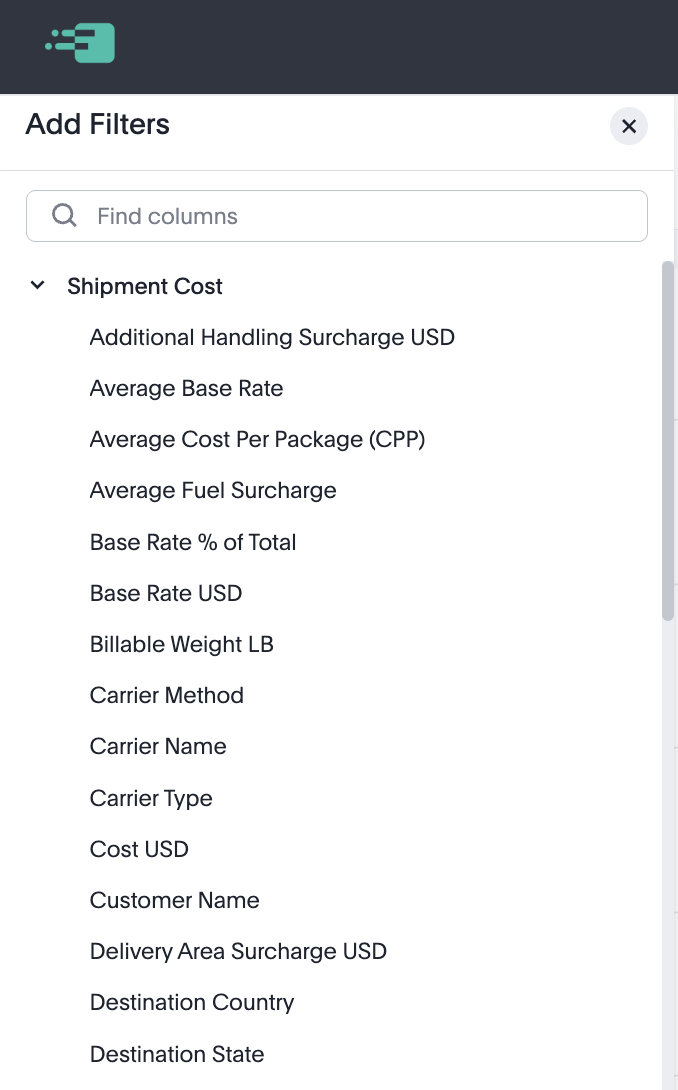
-
Start typing "effective ship date" in the search box.
-
When you see "Effective Ship Date" appear, select it.
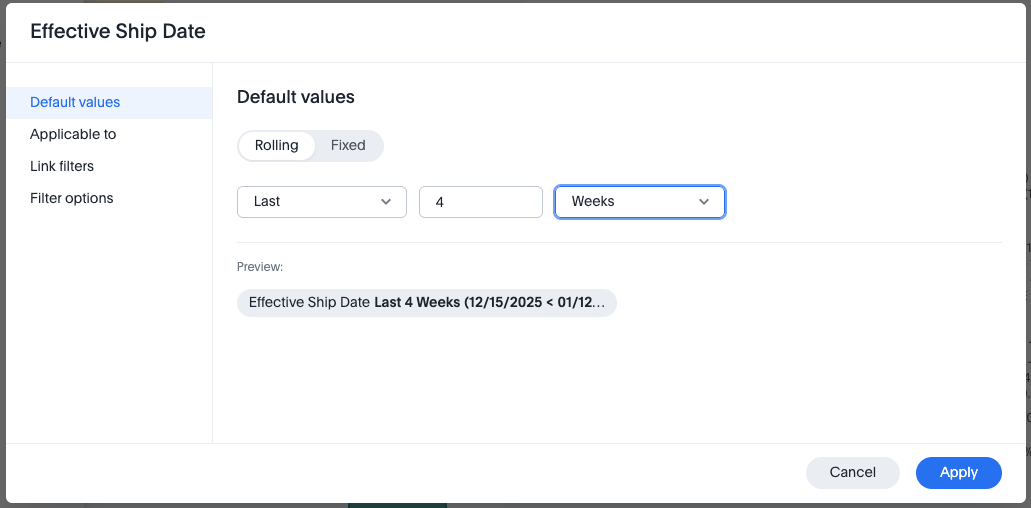
-
Selecting the Effective Ship Date filter brings up a screen with several date-related options. You'll have two main options when setting a default value: Rolling, meaning the last N weeks or days or months, or Fixed, allowing you to set an explicit time range. For most users, a Rolling period for the last 2-6 weeks is probably the most useful, as shown in the following image.
-
Once you click Apply in the dialog window and then Save in the top right main screen for your Personal Metrics, you will have a control for easily setting the date range for the metrics on your Personal Metrics page.
-
You can repeat these steps and add additional filters like Fulfillment Name, Carrier Name, or other things that you think you'll want to filter by frequently.
Always add a time filter to your Personal Metrics board.
Edit individual metrics on your Personal Metrics board
While in Edit mode, each metric displays controls for adjusting its position, size, and layout. You can also delete metrics you no longer need.
The following table describes each control element.
Individual metric controls
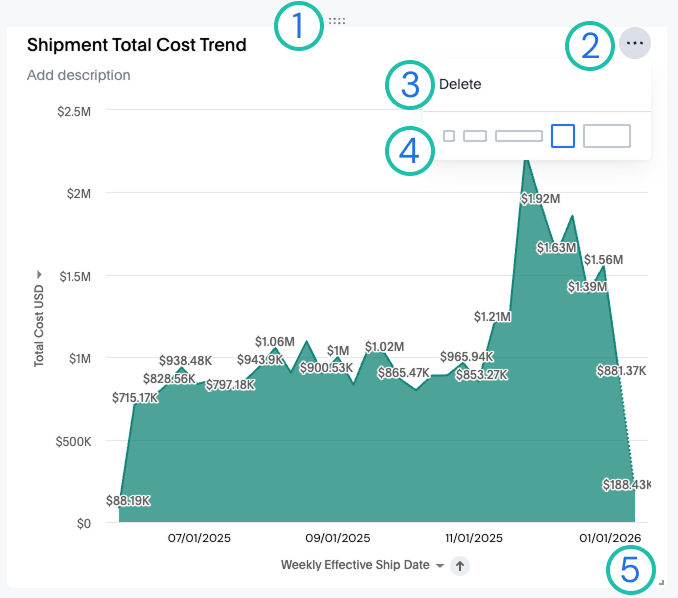
| Number | Element | Description |
|---|---|---|
| 1 | Drag handle | The rectangular collection of dots at the top of each metric in Edit mode is a drag handle. You can click on this area to grab a given metric that you want to move to a different location in your Personal Metrics dashboard. Note: As you move a metric, it will cause other existing metrics to shift around to accommodate the metric's new location. |
| 2 | ... Menu | Clicking on the ... menu on a given metric while in Edit mode brings up the Delete and Quick resize options described below. |
| 3 | Delete | Clicking on Delete removes the metric from the board immediately. Note: There is no warning or second chance when you click Delete (though you can always add the same metric back using the same method used to initially add it). |
| 4 | Quick resize | You will see a set of box drawings. These are preset Quick resize options to quickly resize the current metric into a specific size and shape. You can also achieve the same result with additional more flexible options using the Resize handle below. |
| 5 | Resize handle | You can use the Resize handle in the bottom right of a metric while in Edit mode to change its size and shape to better fit whatever you are looking for. While less easy in some ways than the Quick resize options, this can be used for more flexible design choices than those options alone provide. |
Warning: Clicking Delete on a given metric will cause it to be immediately deleted.
Download and publish your personal metrics
The same options for downloading and publishing metrics that appear in the information about Shipium Orca AI Analytics Dashboards apply here. Scroll down to the section of that page that discusses downloading, publishing, and presenting.
Updated 4 months ago