
Shipment Volume
View your shipment activity over a selected time range.
About shipment volume
The Shipment Volume page provides an aggregate view of your shipment activity over a selected time range. Use it to monitor carrier distribution, service method usage, and origin activity across your fulfillment network.
Data on this page loads on demand and reflects new shipments within seconds to minutes of creation. Results update automatically when you change any filter.
Access shipment volume
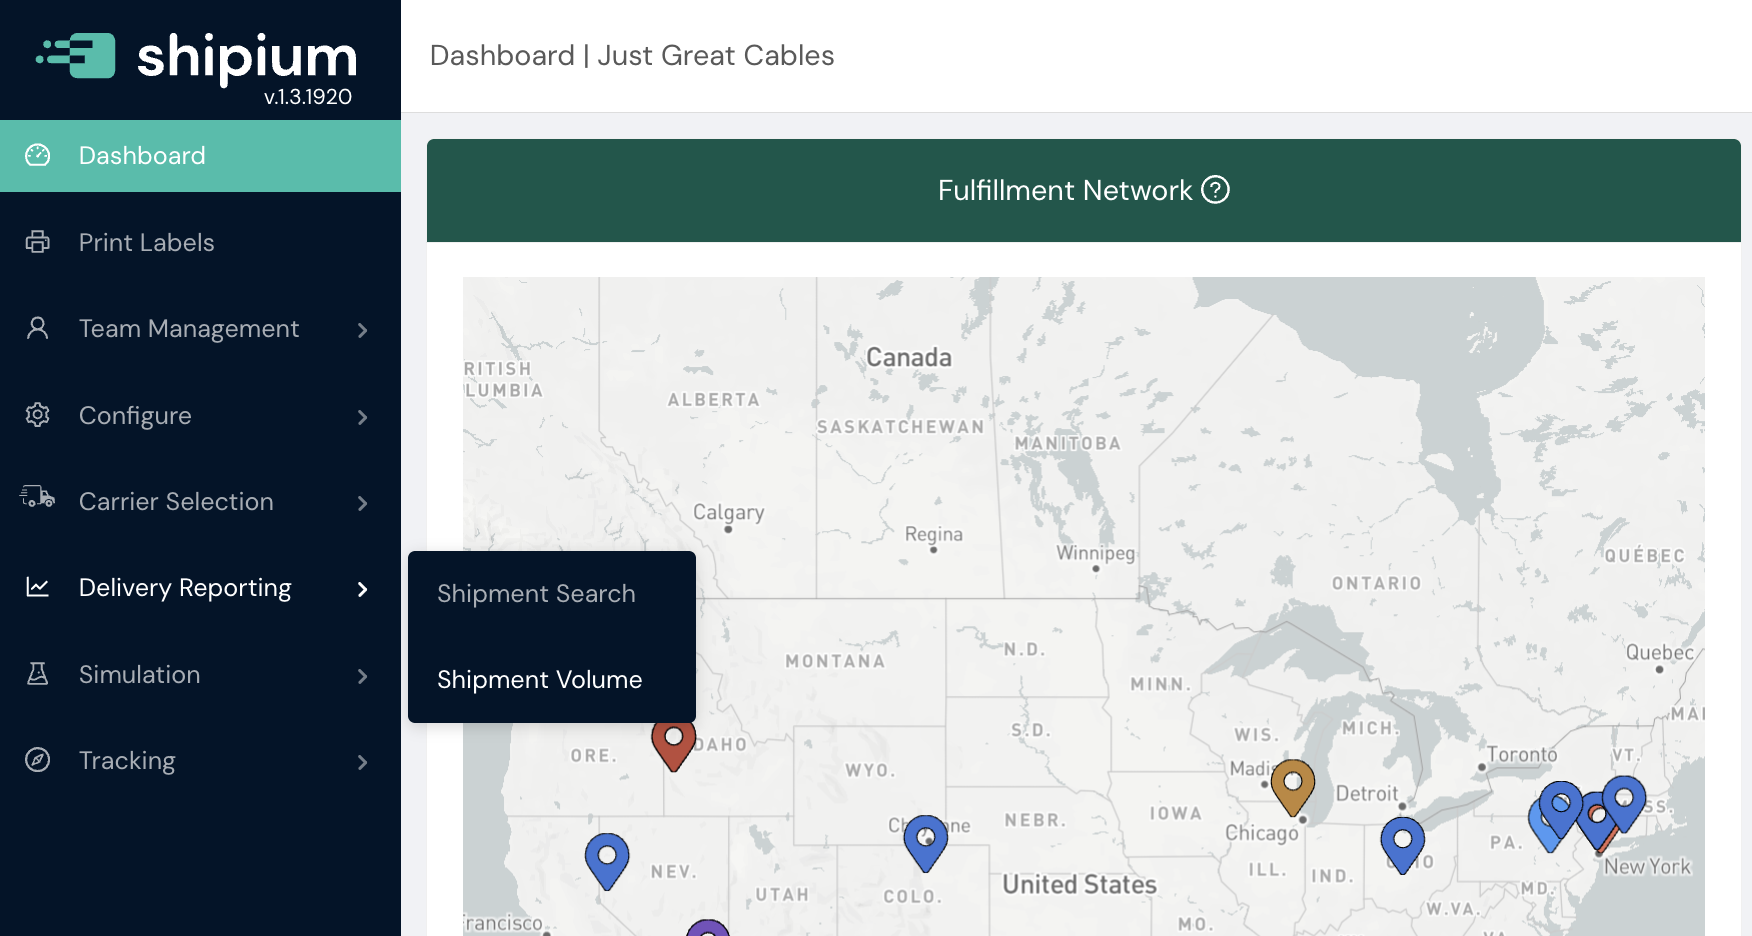
Navigate to Delivery Reporting > Shipment Volume in the Shipium Console left navigation.
Filters
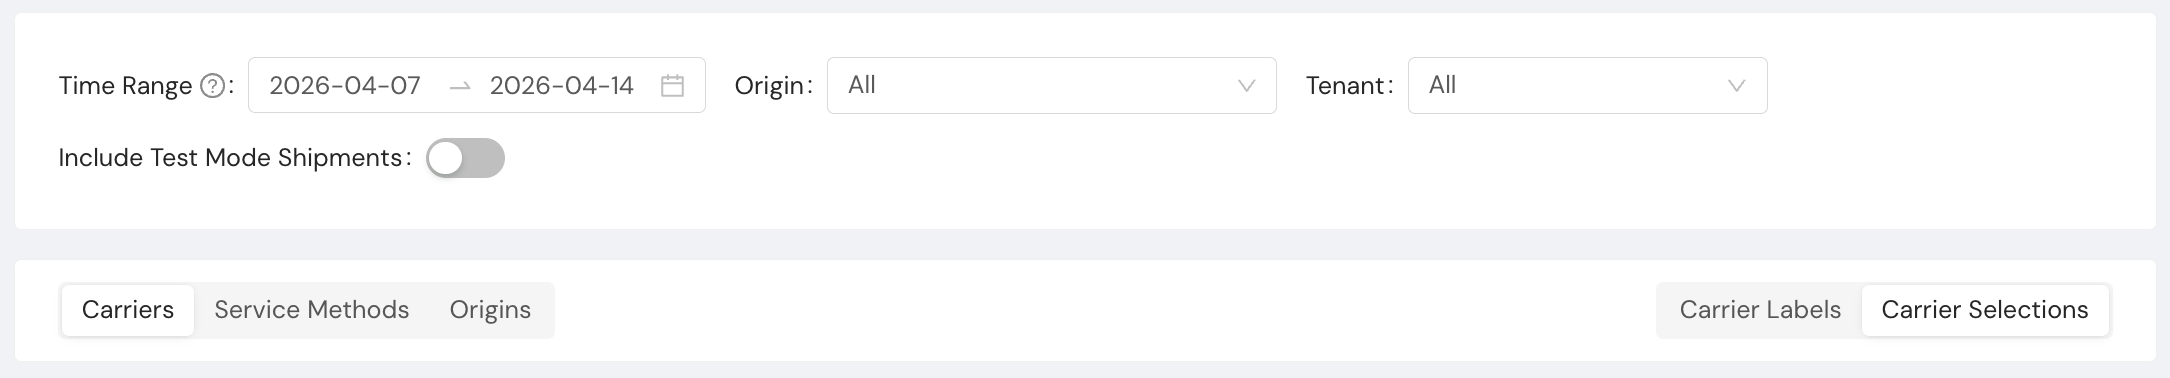
Use the filters at the top of the page to narrow your view:
- Time Range. Select the start and end dates for the data you want to view.
- Origin. Filter results to a specific origin. Defaults to All.
- Tenant. Filter results to a specific tenant. Defaults to All.
- Include Test Mode Shipments. Toggle on to include shipments created in test mode. Test mode shipments are excluded by default.
- Carrier Labels / Carrier Selections. Filter results by the Shipium service used. Select Carrier Labels to view shipments for which Shipium generated the label, or Carrier Selections to view shipments for which Shipium performed carrier selection only.
Tabs
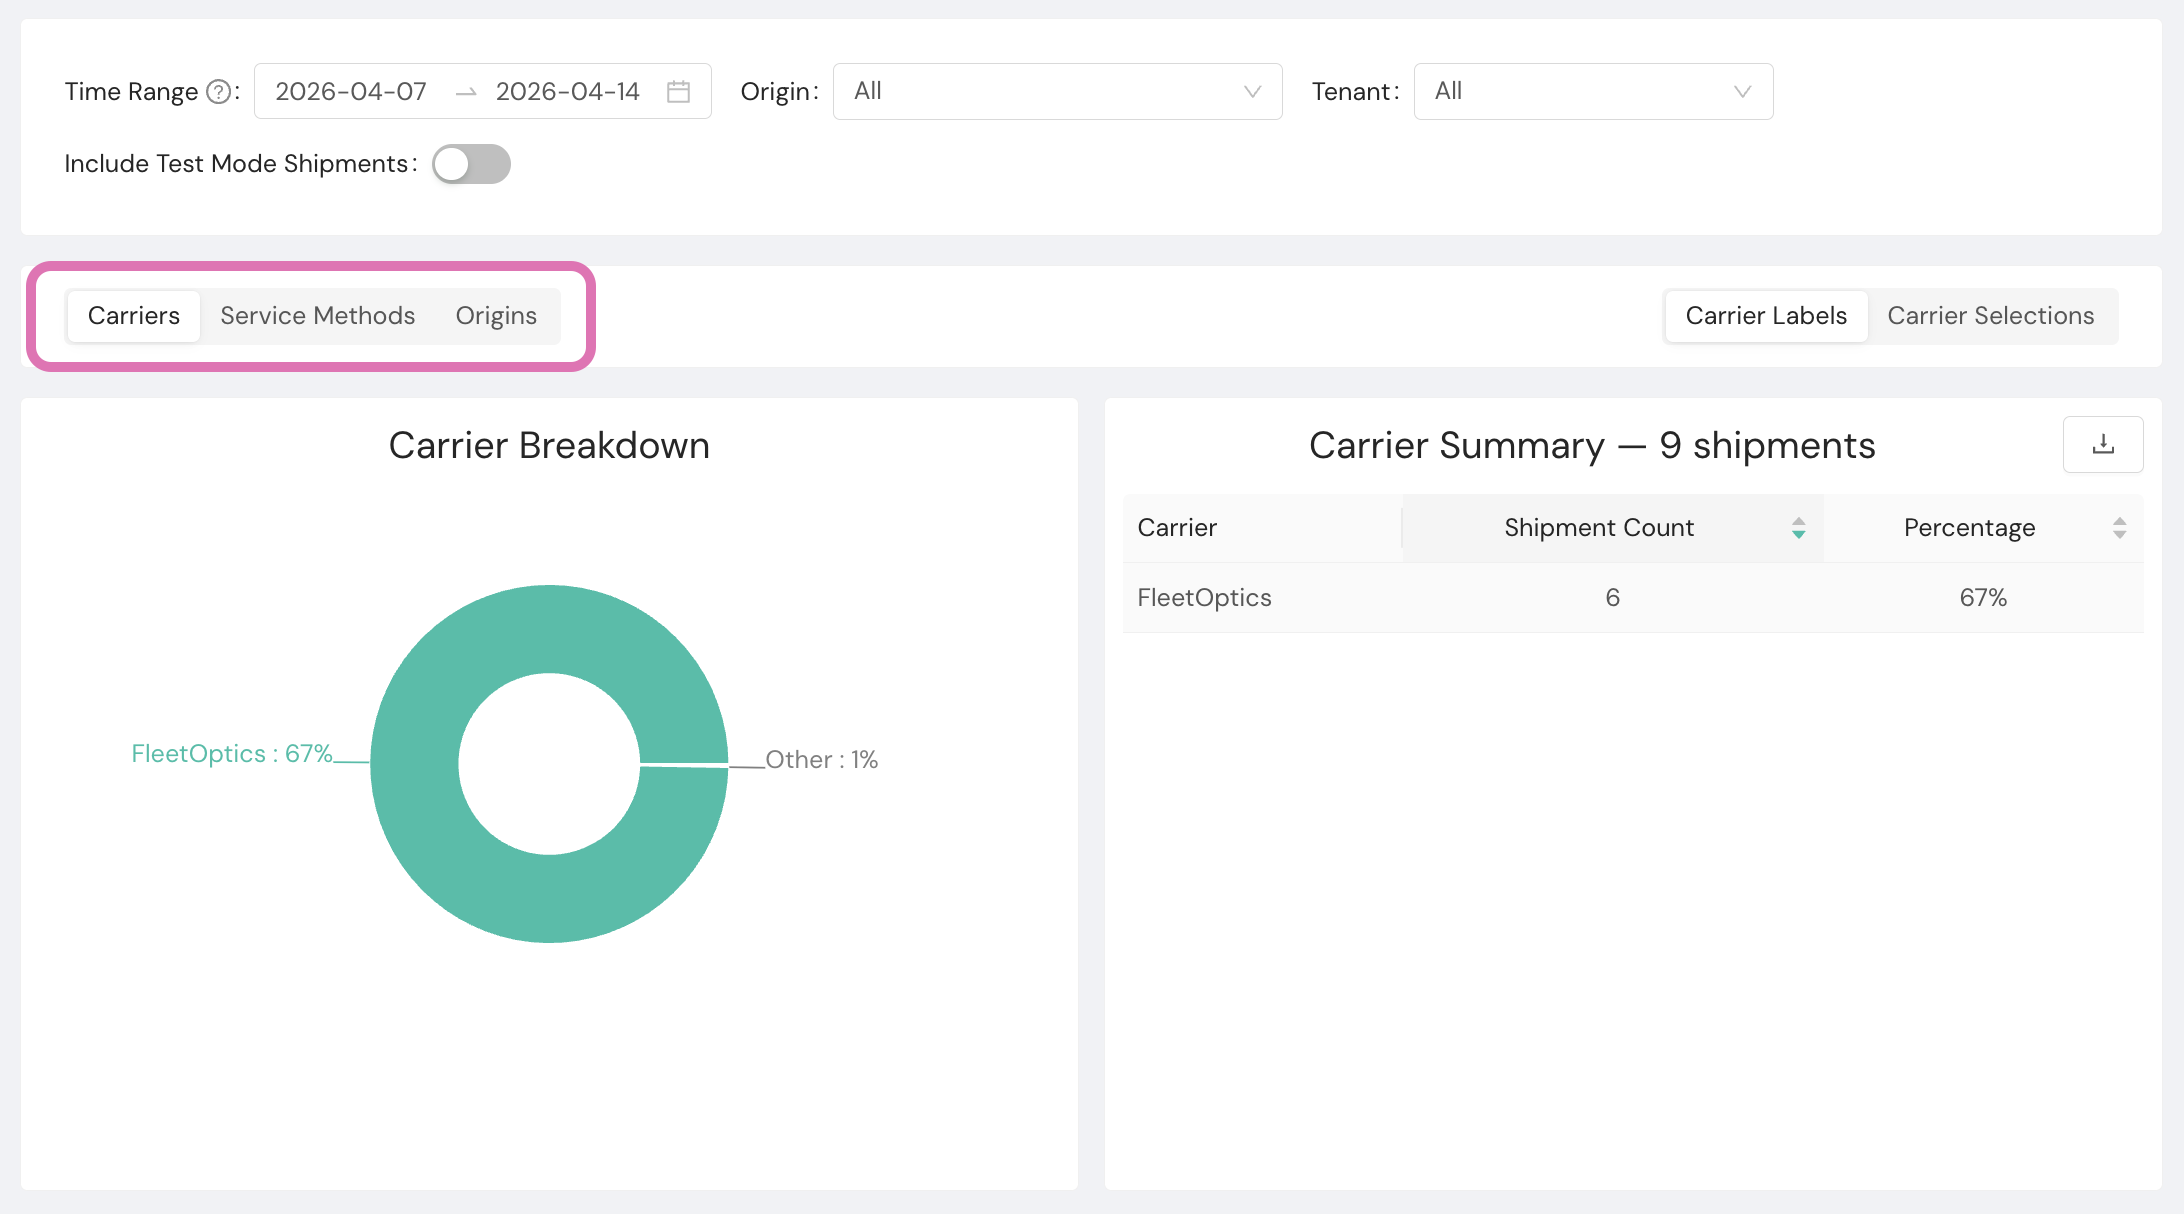
The page is organized into three tabs. Each tab displays the same set of charts filtered through a different lens:
- Carriers. View shipment distribution by carrier.
- Service Methods. View shipment distribution by carrier service method.
- Origins. View shipment distribution by fulfillment origin.
Charts
Each tab includes the following visualizations:
- Breakdown. A donut chart showing the percentage distribution of shipments for the selected time range
- Summary table. Lists each carrier, service method, or origin with its total Shipment Count and Percentage of overall volume. The table header displays the total shipment count for the period.
- Total Volume by Day. An area chart showing aggregate shipment volume for each day in the selected range
- Distribution by Day. A bar chart showing per-day shipment counts broken out by the active tab dimension
Export data
To export chart data as a CSV file, click the download icon on the applicable table or chart.
Resources
Your Shipium team member is available to help along the way. However, you might find these resources helpful:
Updated 3 months ago