
Carrier Selection Shipping Report
Access key insights into carrier selection for your organization.
About the Carrier Selection Shipping Report
The Carrier Selection Shipping Report provides visibility into which carriers and service methods Shipium selected for your shipments over a specified time period. This report helps you analyze carrier usage patterns, monitor service method distribution, and understand how Shipium's carrier selection algorithm performs against your business rules and cost optimization goals.
This report is being retired. Please transition to the enhanced Shipment Volume report. We've kept all your essential data and upgraded the experience: it's faster, features a better design, and includes a test mode filter.
Access the report
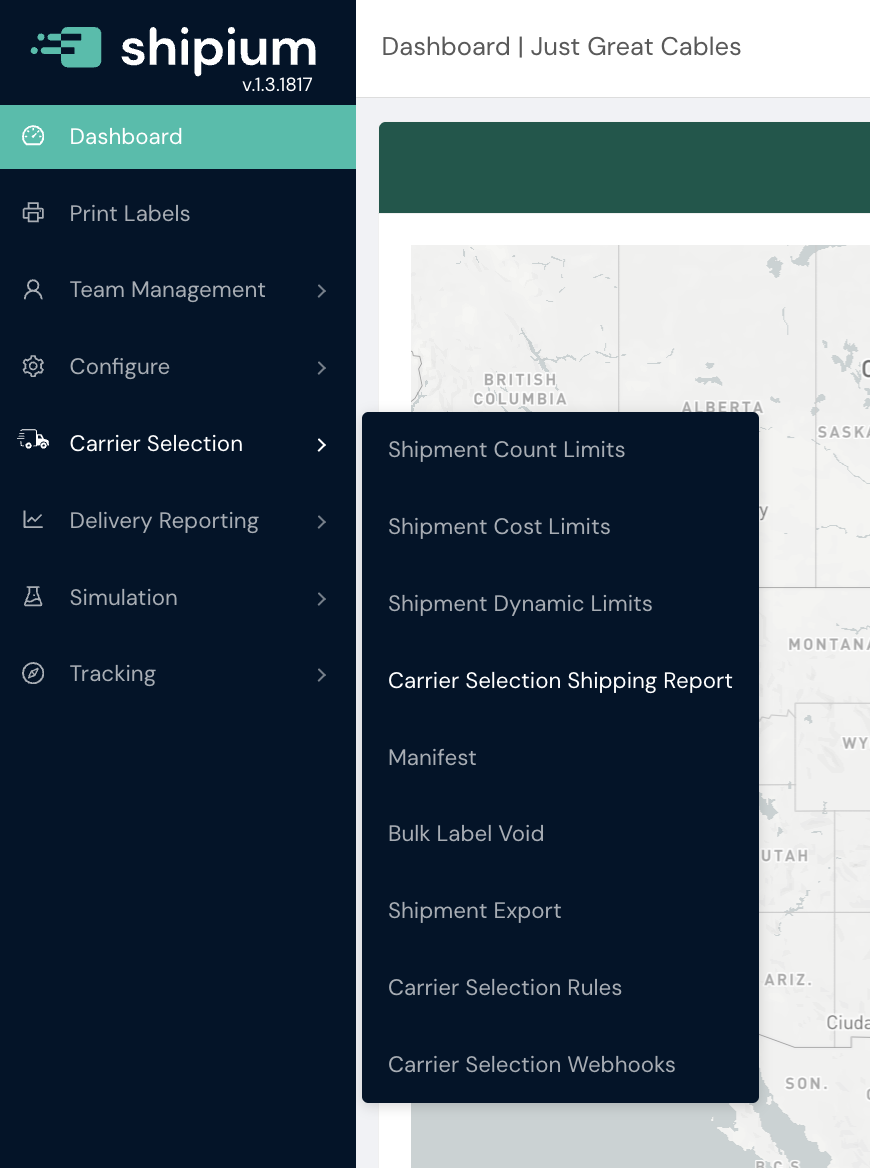
In the Shipium Console, you'll navigate to Carrier Selection and then Carrier Selection Shipping Report. The report is available to users with appropriate permissions to view carrier selection data.
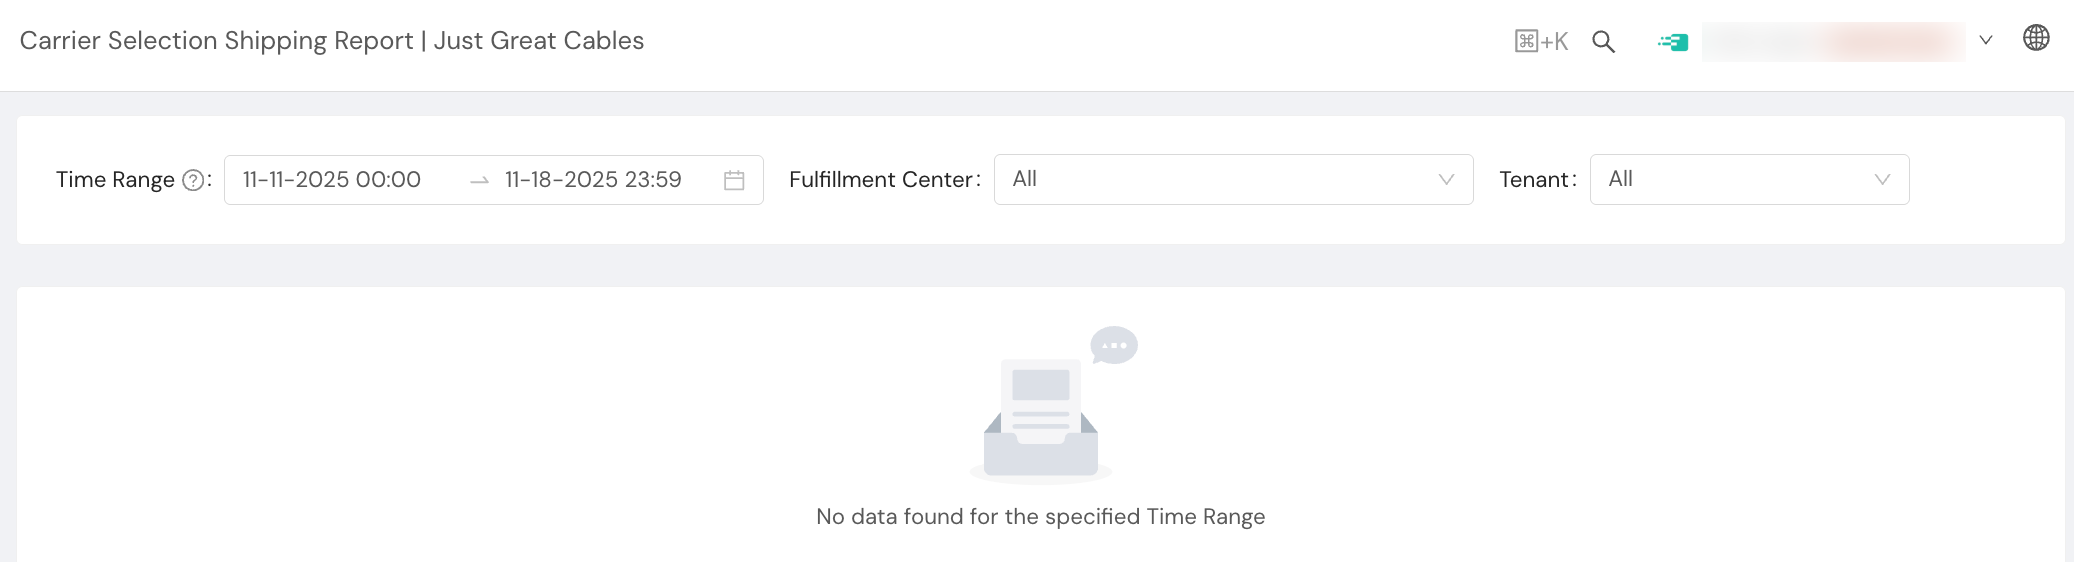
You will use the date picker to specify the Time Range for your analysis. The report displays data for all shipments that completed carrier selection during the selected period. In addition, you can select a specific Fulfillment Center to view carrier selection data for that location, or choose "All" to see aggregated data across all your fulfillment centers. Similarly, you can select a specific Tenant or choose all tenants.
Understanding the report
The Carrier Selection Shipping Report contains three main sections that provide different views of your carrier selection data.
Service method breakdown
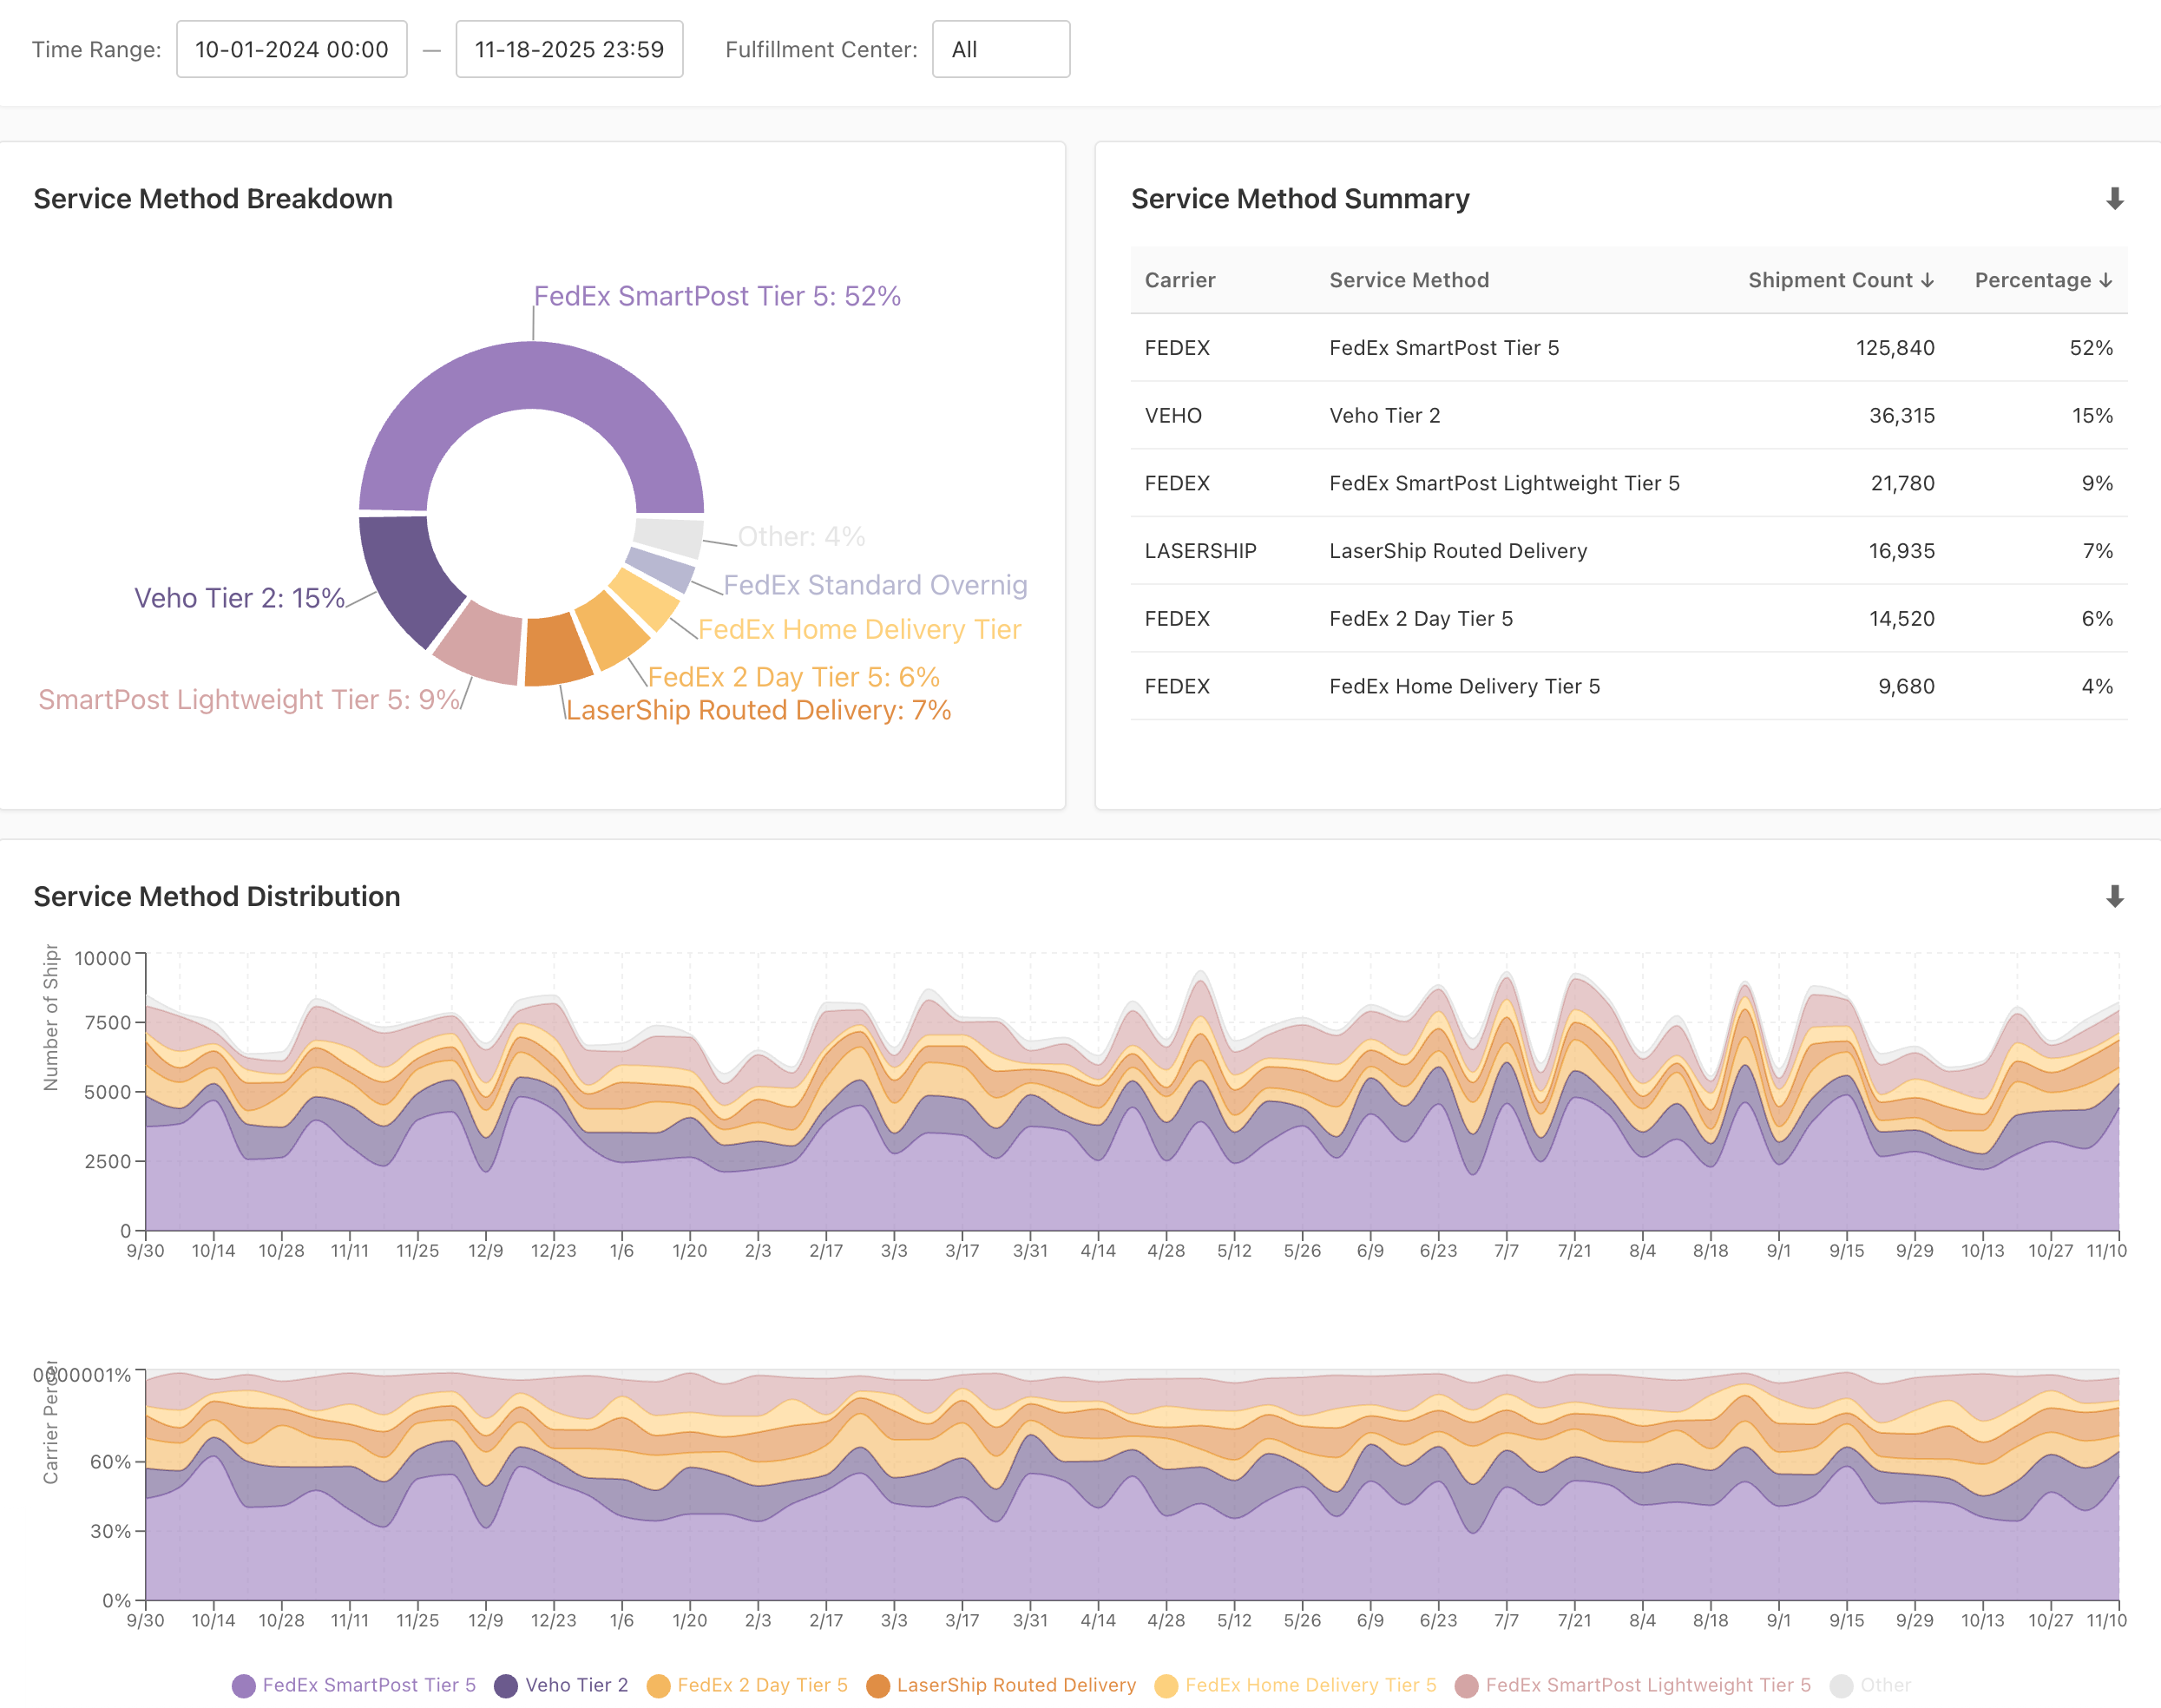
Visual summary. The pie chart displays the percentage distribution of shipments across different service methods selected by Shipium during the reporting period. Each segment represents a unique carrier and service method combination.
Top service methods. Larger segments indicate service methods that were selected most frequently. This view helps you quickly identify your primary shipping methods and understand your overall carrier mix.
Service method summary
Detailed table. The summary table lists all carrier and service method combinations used during the reporting period, sorted by shipment volume.
Key metrics. For each service method, the table shows:
- Carrier. The carrier name (e.g., FEDEX, USPS, VEHO)
- Service method. The specific service level selected (e.g., FedEx SmartPost Tier 5, USPS Priority Mail).
- Shipment count. The total number of shipments that used this carrier and service method combination
- Percentage. The proportion of total shipments that used this service method
Download option. Click the download icon to export the summary table data for further analysis in spreadsheet applications.
Service method distribution
Volume over time. The upper chart shows the daily volume of shipments for each service method throughout the reporting period. The stacked area visualization makes it easy to see both total volume trends and the relative contribution of each service method over time.
Percentage mix over time. The lower chart displays the percentage breakdown of service methods on each day. This normalized view helps you understand changes in your carrier mix regardless of overall volume fluctuations.
Trend analysis. Use these distribution charts to identify patterns such as:
- Seasonal changes in service method usage
- Impact of carrier selection rule changes
- Effects of rate changes or carrier performance on selection patterns
- Volume spikes or drops for specific service methods
Use cases
Cost analysis. Compare the distribution of service methods against your carrier rate structures to understand your actual shipping costs and identify opportunities for cost optimization through carrier selection rule adjustments.
Performance monitoring. Track changes in carrier selection patterns after implementing new carrier selection rules or updating service method configurations. Verify that Shipium is selecting carriers according to your intended strategy.
Capacity planning. Use historical carrier selection data to forecast future carrier usage and negotiate appropriate capacity allocations with your carriers.
Carrier negotiation. Provide volume data to carriers during rate negotiations. The shipment counts and percentages help demonstrate your actual usage patterns and support data-driven contract discussions.
Troubleshooting. If you notice unexpected changes in carrier selection patterns, use this report to identify when the change occurred and which service methods were affected, helping you pinpoint the root cause.
Resources
Your Shipium team member is available to help along the way. However, you might find these resources helpful:
Updated 3 months ago