Shipium Service Status
Check Shipium's service status.
About Shipium's service status
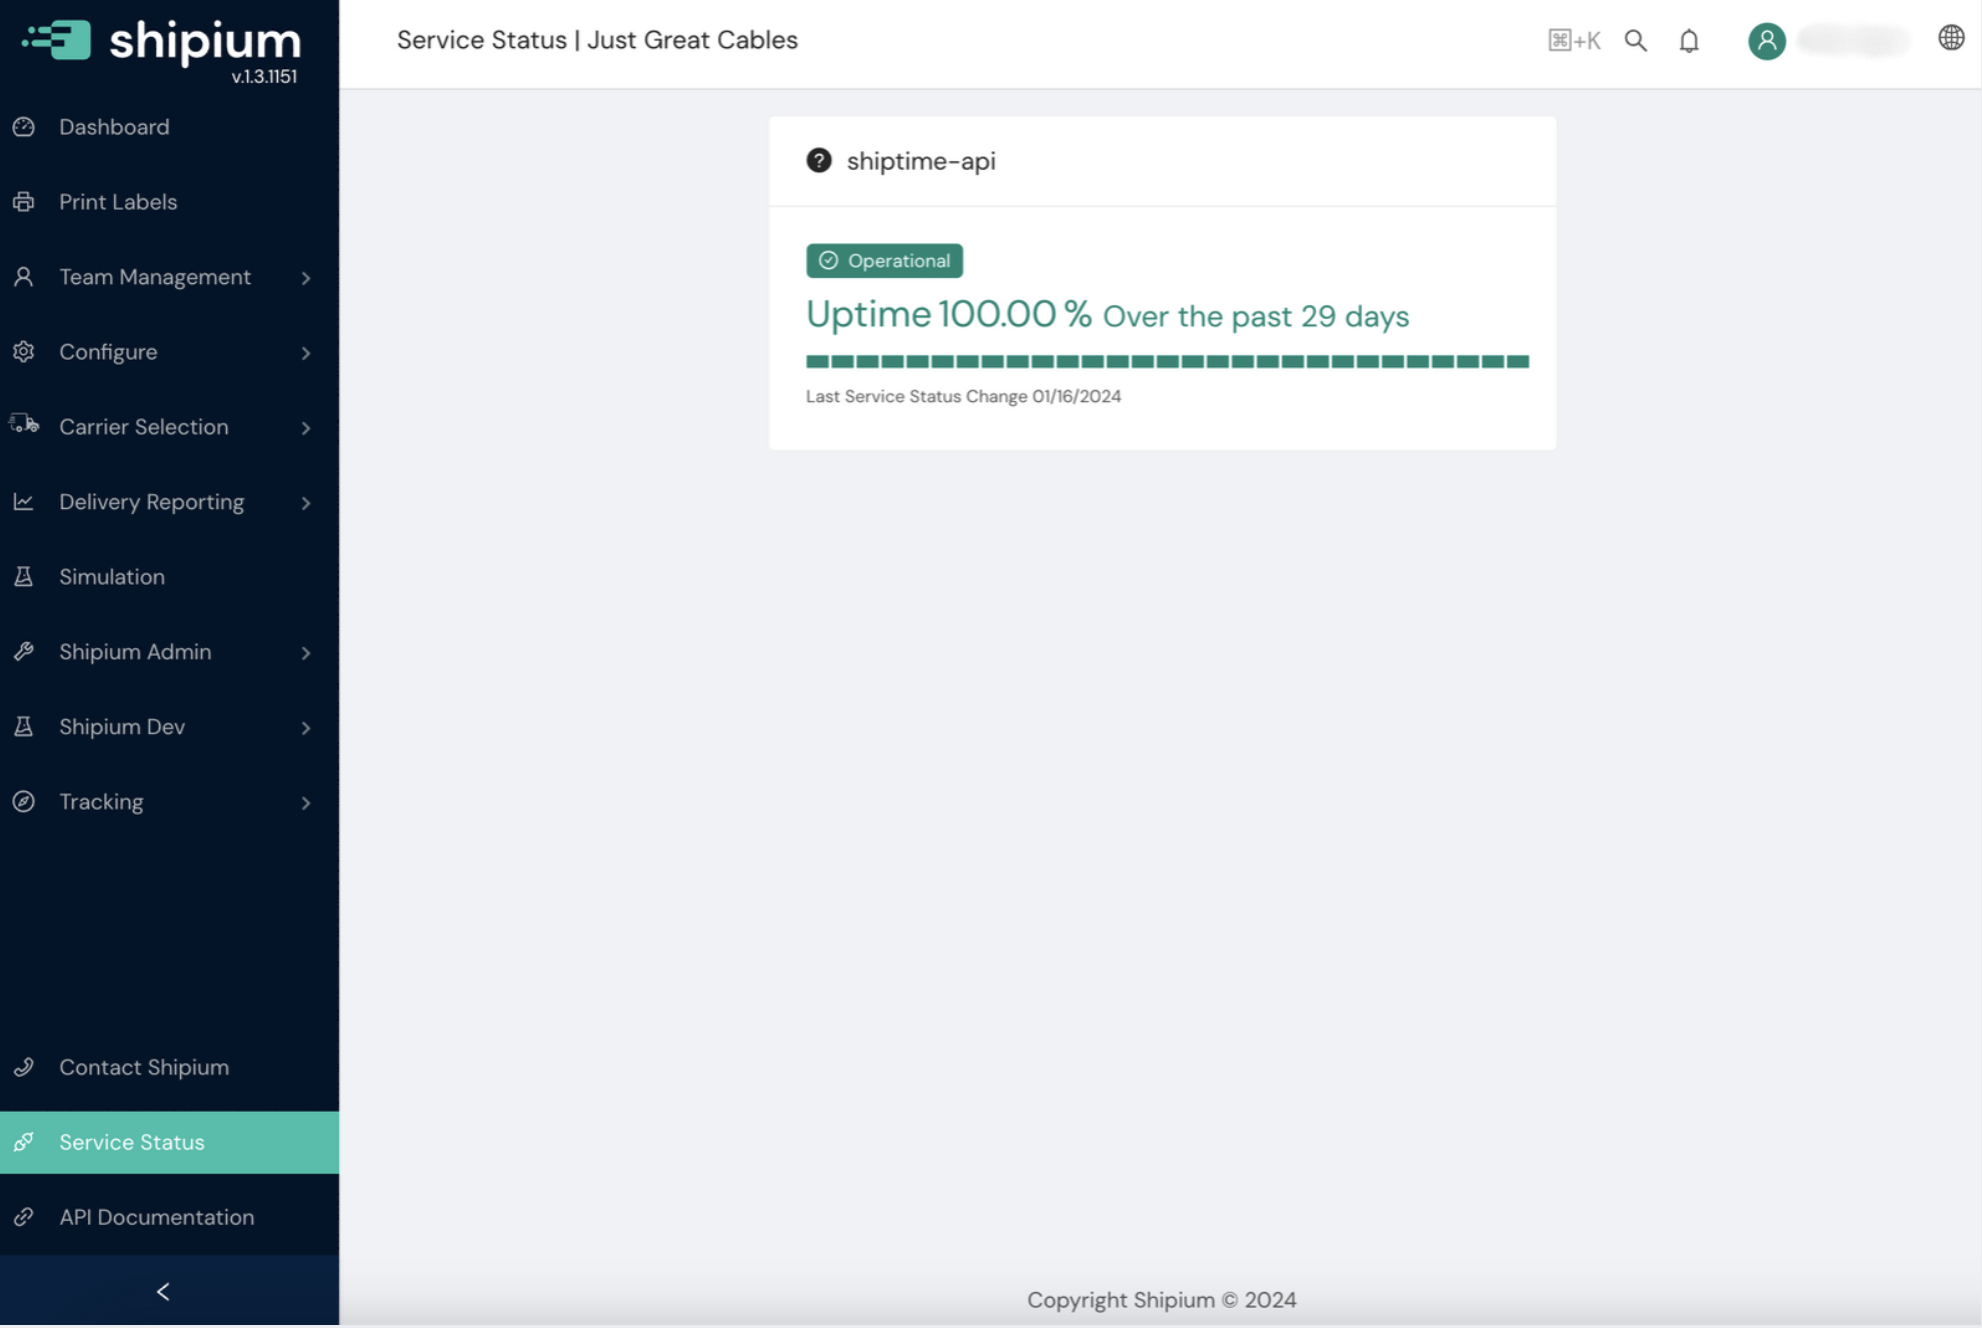
If you believe you may be experiencing an issue with one or more Shipium applications or with portions of the Shipium console itself, the Shipium Service Status page is a good place to check the current state of the various Shipium applications and services. You can access the status by selecting Service Status from the left navigation menu.

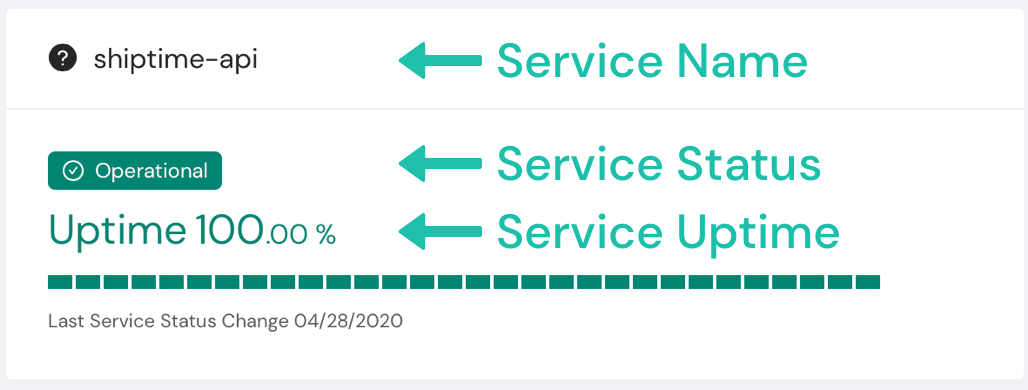
The service status provides the name of the service, its status, and its uptime.

Service name
This is the name of the service being monitored. To the left of the service name is a small question mark icon. Hovering on this icon will give you a description of the service being monitored.
Service status
This is the current status of the service in question. Operational indicates a functional service. However, you may also see descriptions covering the service in question being down or impacted in some way, such as degraded performance. In these cases, you should contact Shipium for support, though we should already have been alerted of service issues that would show either degraded or down here.
Service uptime
The service uptime will show you how long the service has been operational during the timeframe described. For instance, an uptime of 100.00% over 24 hours means that there have been no outages or downtimes during the prior 24 hours. An uptime of 97.92% over the prior 24 hours would mean a 30-minute outage sometime in the past 24 hours, and the outage time would be reflected in the graph as well.
Resources
Your Shipium team member is available to help along the way. However, you might find these resources helpful:
Updated 6 months ago
