
Label Failovers Dashboards
View reports for label failovers and their associated costs.
About the Label Failovers dashboards
The Label Failovers dashboards focus on label failover activity, presenting the total volume of labels that encountered a failover status. It is designed to display only the data for labels marked with the status of "failover", enabling analysis of the instances where the primary carrier was inaccessible and a secondary carrier option was selected. This insight aids in understanding the frequency and trends of failover occurrences, which supports more informed decision-making for shipping and carrier management.
Two key terms are used in the dashboards:
- Failover From. Refers to the carrier and service method that could not be accessed.
- Failover To. Refers to the carrier and service method that were successfully selected after the initial failover.
There are two Label Failovers dashboards:
- Label Failovers Volume & Cost. This dashboard displays the number of label failovers and the associated costs, split by carrier and service method.
- Label Failovers Data Export. This data table allows filtering by carrier, carrier service method, cost per package (CPP), total cost impact (delta between failover from and failover to CPP) . You can export filtered data to a CSV file.
Customer data securityWith Shipium’s reporting applications, you can count on your data being secure:
- Data encryption
- Compliance
- Access controls
- Security audits
This document provides an overview of the Label Failovers dashboards, outlining their functionality, handling of data exceptions, and key definitions. You can refer to the Reporting Product Overview documentation for more general information on Shipium reporting and user roles.
Shipium also offers label failover reporting through Shipium Orca AI Analytics. If you have access to Orca AI Analytics, see the Label Failover Dashboard for that platform's reporting.
Access the Label Failovers dashboards
To access any dashboard, you’ll need to log in to the application:
- Go to the Shipium-provided URL.
- Log in using your credentials: email, password, and a multi-factor authentication (via phone or email).
Next, you’ll navigate to the dashboard:
- After logging in, you’ll use the vertical menu on the left side of the screen.
- Go to the folder labeled “Label Failovers Dashboards”. You’ll select any of the dashboards nested under this folder to view their particular content.
View Label Failovers dashboards
This section includes instructions for each of the Label Failovers dashboards as well as default settings, metrics, and data nuances for these reports.
Filters for each dashboard are defined in the following table.
| Filter name | Description |
|---|---|
| Carrier (Failover From/To) | Name of the shipping carrier (e.g., USPS, UPS, FedEx) |
| Carrier Service Method (Failover From/To) | The shipping method offered by the carrier (e.g., overnight, ground) |
Terms used in these dashboards are defined in the following table.
| Term | Defintion |
|---|---|
| Failover From Carrier | The carrier that failed to generate the label |
| Failover From Carrier Service Method | The service method of the carrier that failed to generate the label |
| Failover From Rate | The label cost of the carrier that failed |
| Failover To Carrier | The carrier selected on the next attempt, successfully generating the label |
| Failover To Carrier Service Method | The service method selected on the next attempt, successfully generating the label |
| Failover To Rate | The label cost of the carrier selected after failover |
Label Failovers Volume & Cost
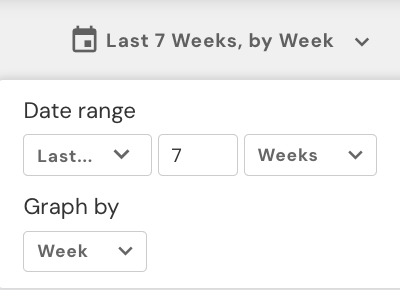
While the default setting is a label creation period of the last seven weeks, grouped by week, you can adjust the dates in the top-right corner and apply filters across the top of the dashboard.

For each filter, this dashboard provides the following reports:
- Label Failover Volume
- Failover Percentage of Total Labels
- Label Failovers Volume & Cost
- Total Failover Label Count
- Failover Volume Over Time
- Failover Percentage of Total Labels
- Failover Percentage of Total Labels Over Time
- Failover From/To CPP
- Failover From/To CPP Over Time
- Failover Cost
- Failover Cost Over Time
- Failover From Carrier Volume Mix
- Failover From Carrier Volume Mix Over Time
- Failover To Carrier Volume Mix
- Failover To Carrier Volume Mix Over Time
- Failover From Service Method Volume Mix
- Failover From Service Method Volume Mix Over Time
- Failover To Service Method Volume Mix
- Failover To Service Method Volume Mix Over Time
You can also click on specific visuals (e.g., Failover From Carrier Service Method Volume) to filter the rest of the dashboard accordingly. For each filter, this dashboard provides the volume mix percentage and the CPP over time.
Label Failovers Data Export
As with the Label Failovers Volume & Cost Dashboard, you can adjust the reporting dates in the top-right corner and apply filters via the drop-downs across the top of the dashboard.
Then you can export the data table as a CSV or Excel file, with the following restrictions:
- The reporting tool only supports exporting one million rows at a time.
- Data is not available at the shipment ID level.
Default settings
Each dashboard defaults to a label creation period of the last seven weeks, grouped by week. You can adjust the time period filter for any period after 1/1/2023.
Other filters available include carrier, carrier type, carrier service method, service level type, origin state, and destination state.
Metrics
The following metrics are provided for the Label Failovers dashboards:
- Failover Volume. The total number of labels that experienced a failover
- Failover From CPP. The cost per package (CPP) for the carrier that failed to generate the label
- Failover To CPP. The cost per package (CPP) for the carrier that successfully generated the label after failover
- Failover Percentage of Total Label Count. The percentage of failover labels relative to the total label volume
Data nuances
The following data nuances apply to the Label Failovers dashboards:
- All visuals are based on the label creation date.
- Data is available starting from January 1, 2023.
Resources
For assistance, reach out to your Customer Success Manager. Response times are typically within 2 to 5 business days.