
Shipium Orca AI Analytics Dashboards
This guide covers the common interface elements and features shared across all Orca AI Analytics dashboards.
About Orca AI Analytics dashboards
Shipium Orca AI Analytics includes several dashboards, each providing insights and real-time visibility into different areas of your business. While each dashboard focuses on different data, they all share a common interface and functionality.
Common dashboard functionality
The following features and functionality are available across all Shipium Orca AI products. Some dashboards may have different filter options, but the core functionality remains the same.
Dashboard layout
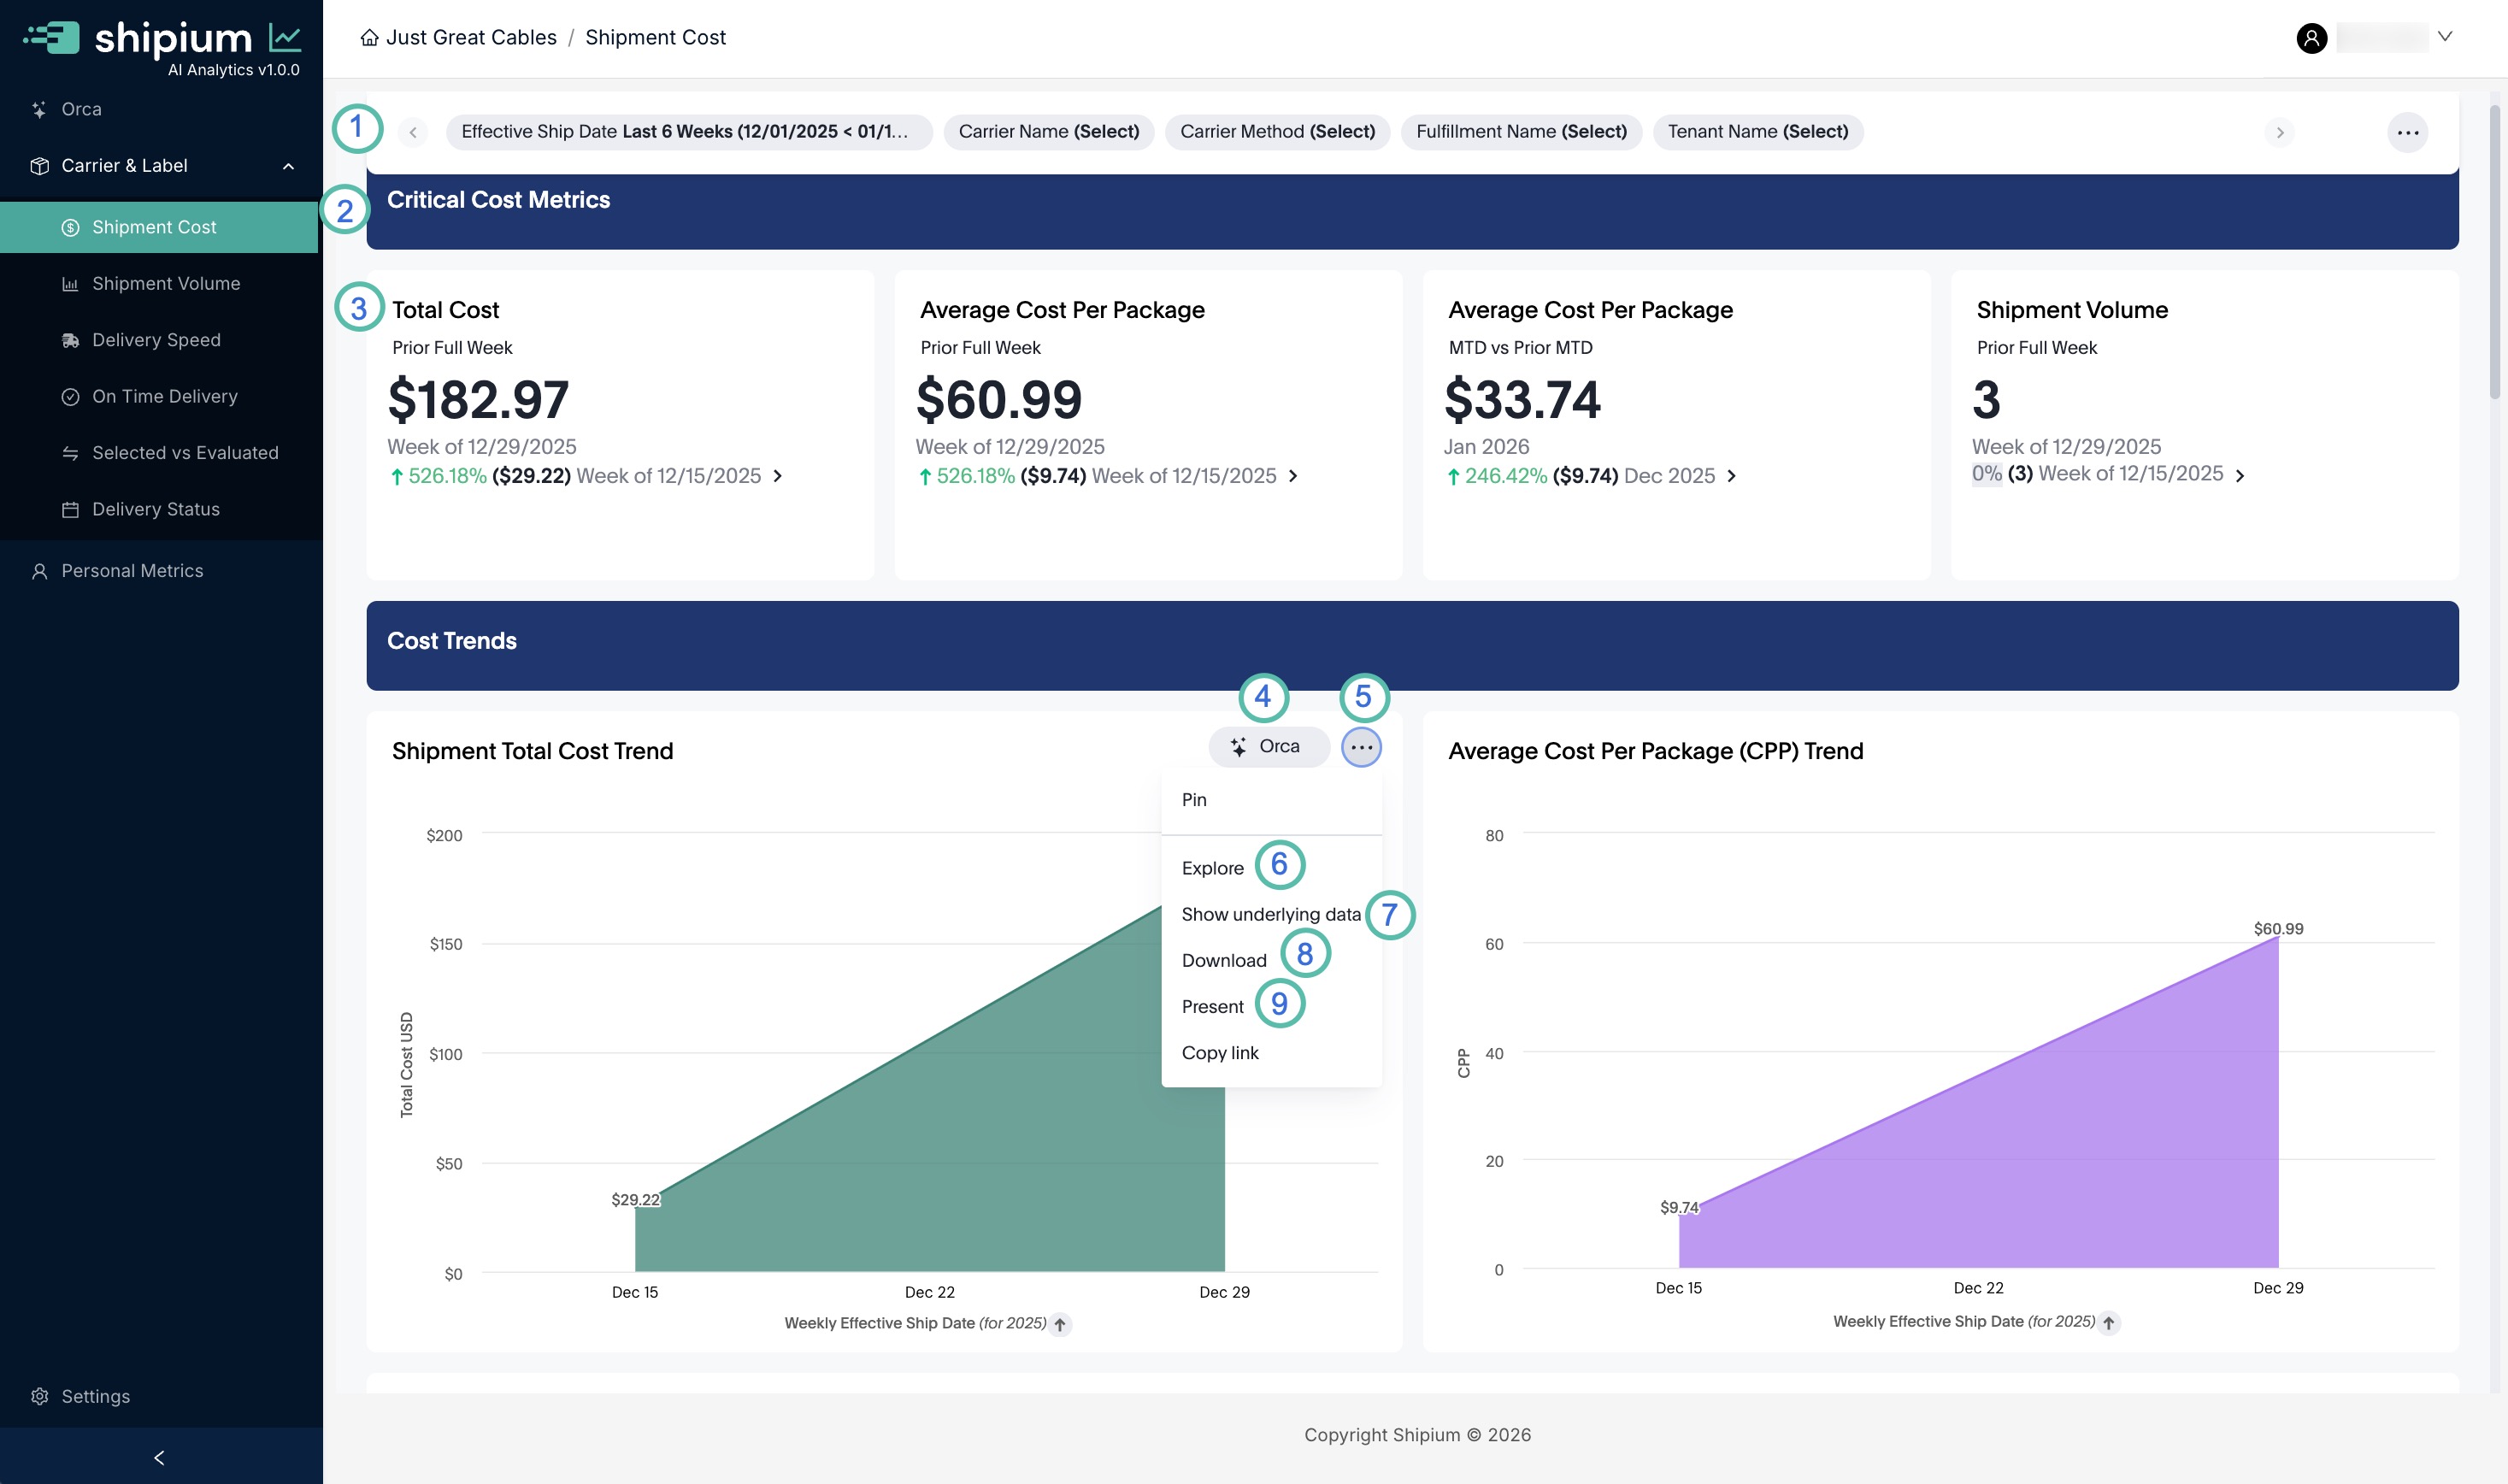
Common dashboard elements are annotated in the image above and described in the following table.
| Number | Element | Description |
|---|---|---|
| 1 | Filters | Use filters to narrow the data displayed on the dashboard. For example, selecting a specific time frame limits all metrics to that period. See Using filters for details. |
| 2 | Section label | Each dashboard is organized into sections based on the type of data displayed, making it easier to find what you're looking for. |
| 3 | Metric | A metric is any data display on the dashboard, whether it's text, a graph, or a map. |
| 4 | Orca button | Click the Orca button on most metrics to get additional AI-generated insights about the data shown. |
| 5 | Metric options | Click the ellipsis (...) to open the options menu for a metric (which is open in the image above). |
| 6 | Explore | Explore opens a larger version of the metric with options to modify it, such as adding filters or changing the time frame. |
| 7 | Show underlying data | Show underlying data displays a tabular view of the data behind the metric. You can download this data as a CSV for use in Excel, Google Sheets, or similar applications. |
| 8 | Download | Click Download to download the metric data as CSV, Excel, or PNG image. |
| 9 | Present | Click Present to open full-screen presentation mode for the current metric. Use the arrow keys or on-screen arrows to navigate between metrics. |
Using filters
Each dashboard includes filters you can apply to narrow the data displayed. You can set filters independently or combine multiple filters — all selected filters are applied together before displaying the dashboard.
The common filters for Carrier & Shipment metrics are listed below.
| Filter Name | Filter Description |
|---|---|
| Effective Ship Date | A range of time must be selected for the effective ship date of shipments (e.g., when each was expected to be handed off to a carrier). Defaults to the range 6 weeks ago to now. |
| Carrier | One or more carriers can be selected to show the metrics on the dashboard for only those carriers. Defaults to all carriers. |
| Carrier Method | One or more carrier methods can be selected to show the metrics on the dashboard for only those carrier methods. Defaults to all carrier methods. |
| Fulfillment Name | One or more fulfillment names (fulfillment contexts) can be selected to show the metrics on the dashboard for only those fulfillment names. Defaults to all fulfillment names. |
| Tenant Name | One or more tenant names can be selected to show the metrics on the dashboard for only those tenant names. Defaults to all tenant names. |
| Timezone | A timezone for reporting must be selected for use when doing time calculations (such as the effective ship date). Defaults to your organization's default timezone for reporting. |
Dashboard features
Dashboards include several features that apply to the entire view. The sections below describe each feature based on the following screenshot.
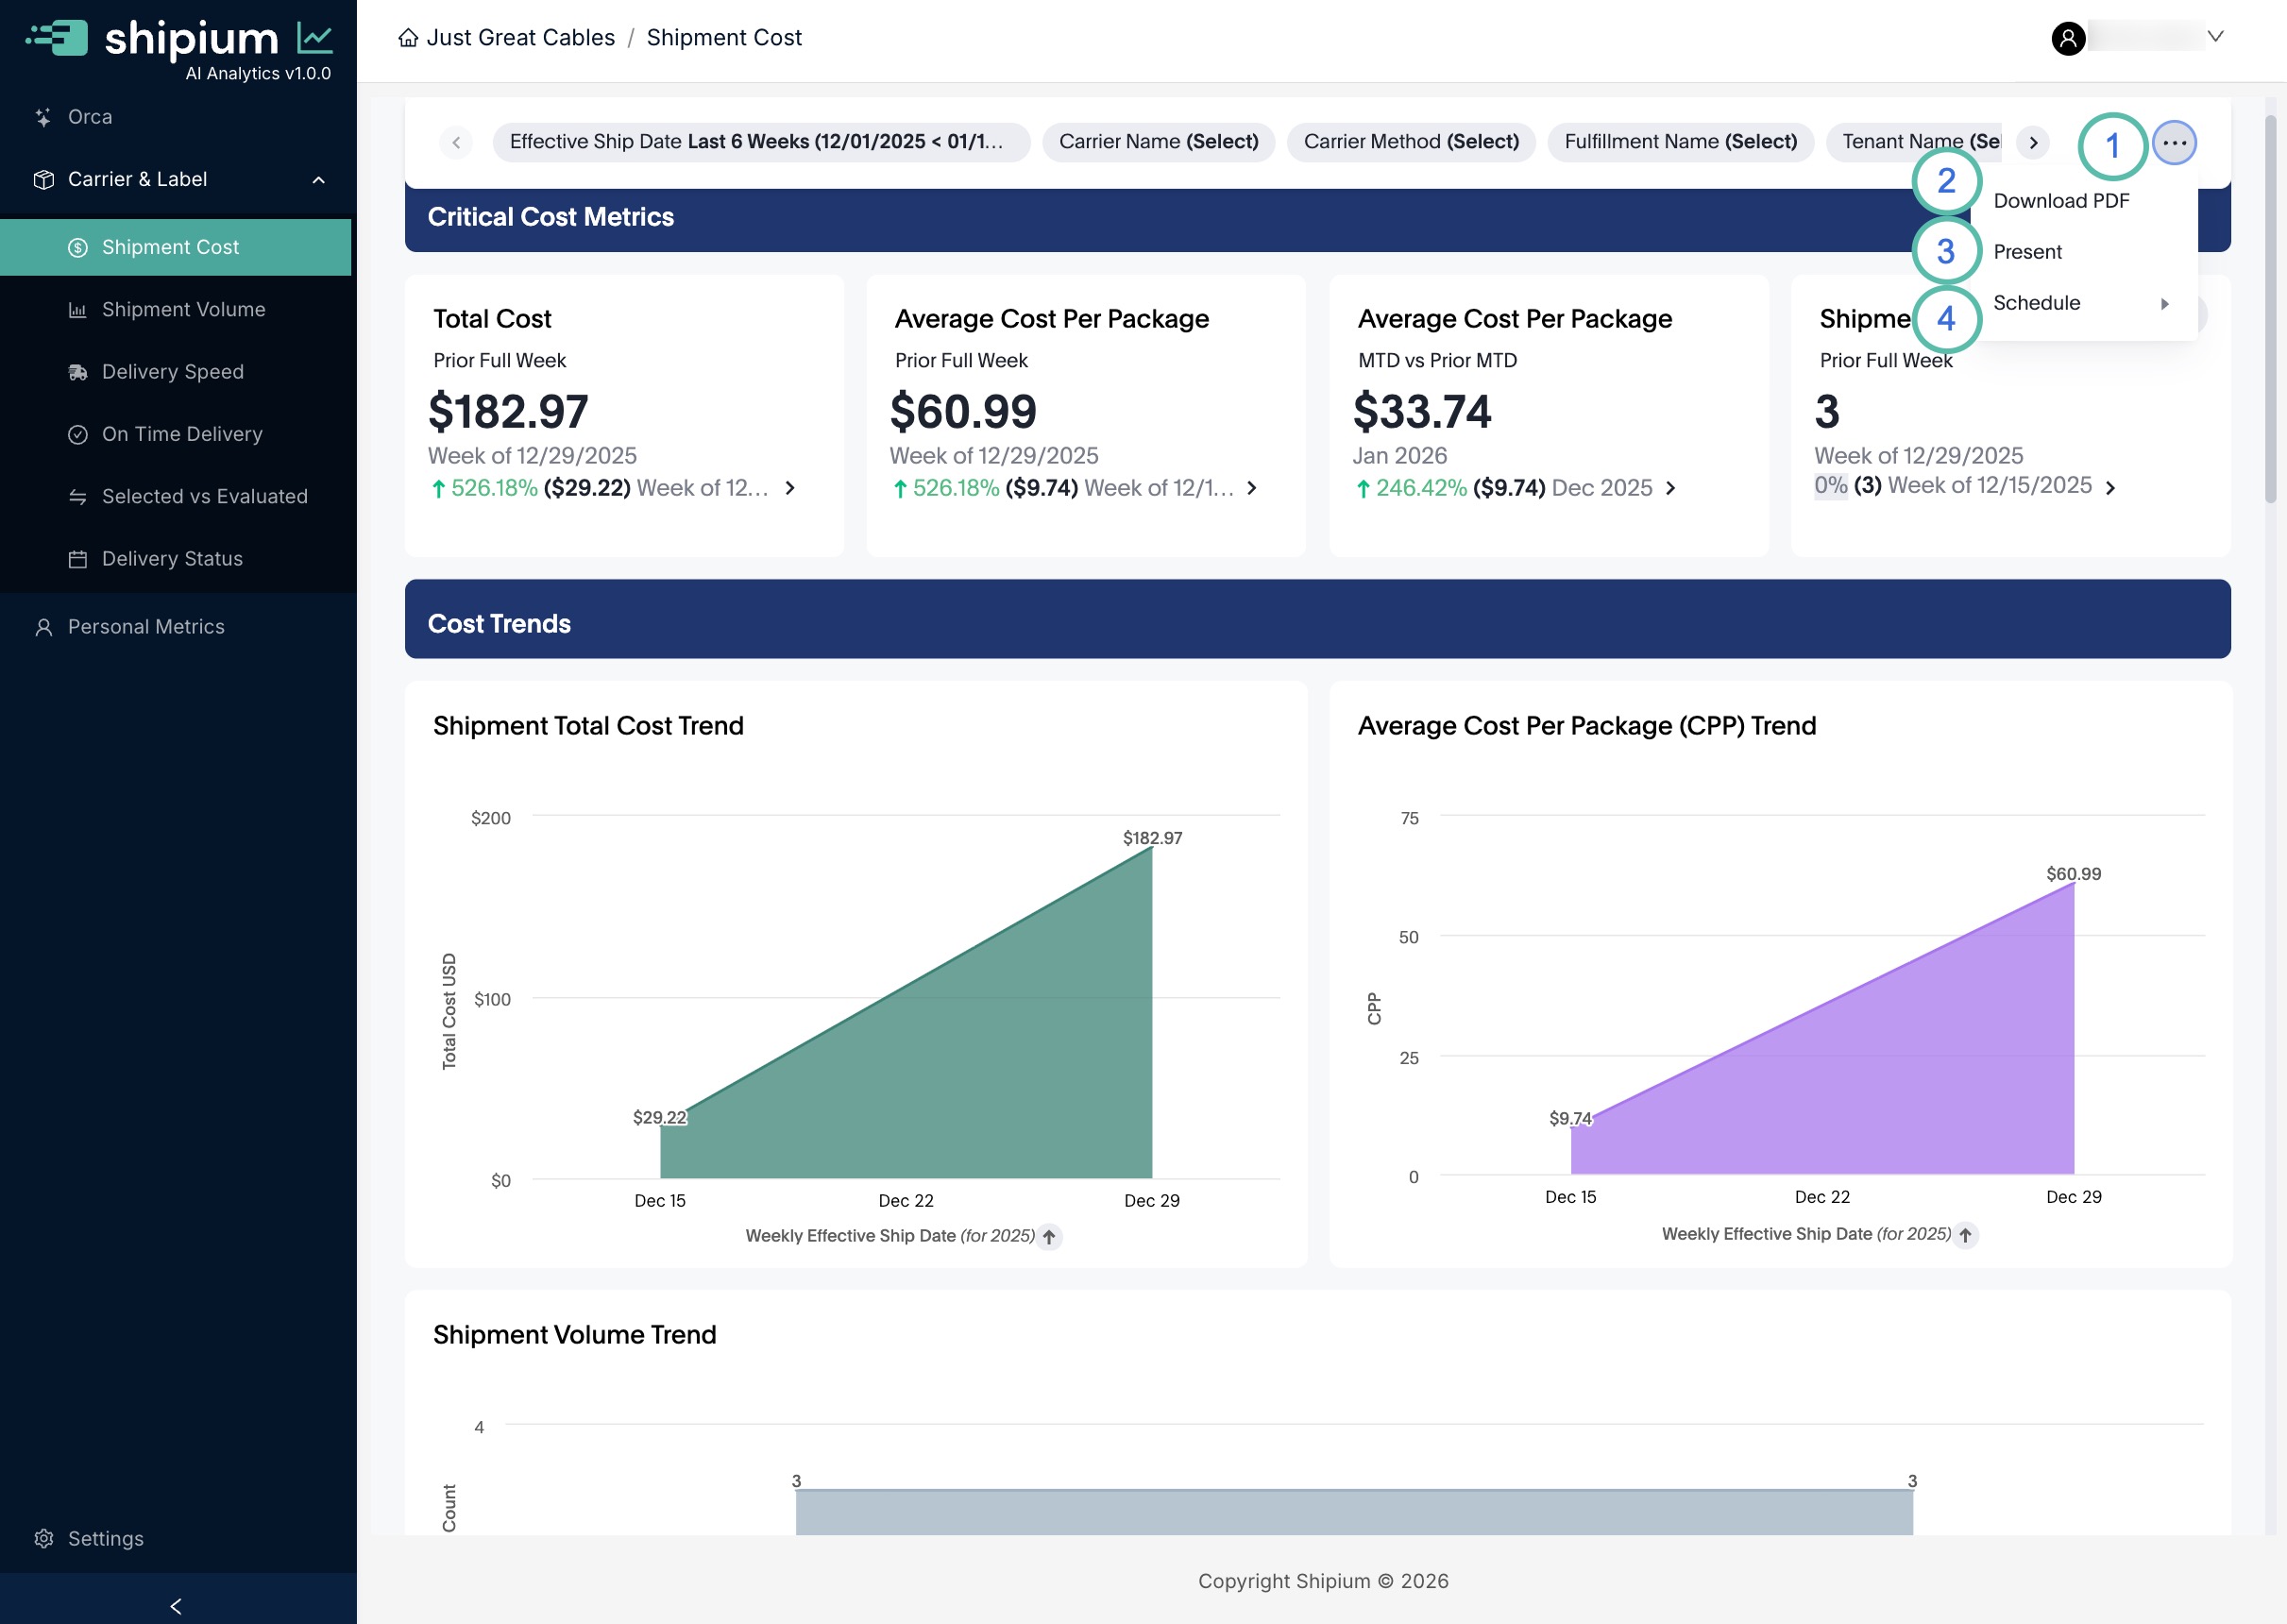
Dashboard options menu (1)
Click the ellipsis (...) to open the dashboard options menu, which provides access to the features described below.
Download a dashboard PDF (2)
Click Download PDF to export the current dashboard. You can choose from two formats and several additional options.
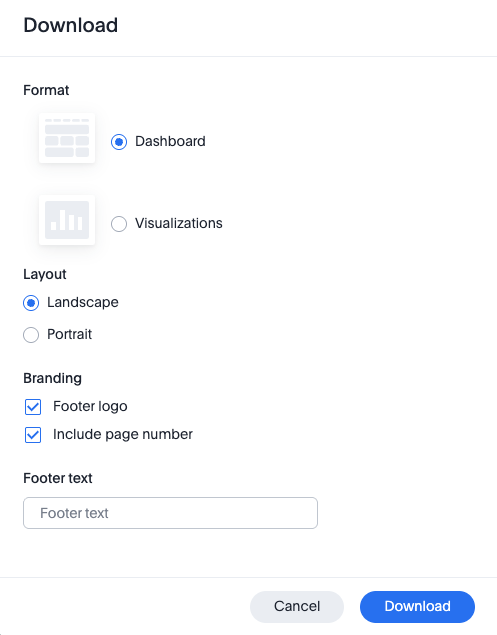
Format
There are two different styles of layout for the document:
- Dashboard. Selecting "Dashboard" will enable you to download the entire dashboard in either landscape or portrait orientation. This is the easiest way to export an entire dashboard for sharing. The PDF layout closely matches what you see on screen.
- Visualizations. If you only want to download a subset of the metrics on a page or you want every metric to be on its own page of the PDF, then selecting "Visualizations" is the best choice. You can select which metrics to include in the final PDF.
Layout
You can have the dashboards that are sent via email in either Landscape (wider) or Portrait (taller). The default is landscape since most reports in the dashboard are easier to read in a wider format, though both work well in document form.
Branding
- Footer logo. Selecting this option will include the Shipium logo in the bottom right of each page.
- Include page number. Selecting this option will include the page number in the bottom right of each page.
Footer text
Text entered here appears in the footer of each page on the left side. This is commonly used for privacy notices or internal-only messaging.
Presentation mode (3)
Click Present to enter presentation mode, which does the following:
- Full screen. The browser window you're viewing the dashboard in will become a full-screen window for maximum viewing size.
- Single metric display. Each metric on the dashboard (as well as each piece of text or header) will be shown once at a time, effectively turning the dashboard into a series of individual slides.
- Keyboard navigation. In addition to the clickable arrows in the top right hand of the screen, you can also move forward or backward through the slides in presentation mode as well as exiting presentation mode using the following keyboard keys:
- Right/Down arrow. Next slide
- Left/Up arrow. Previous slide
- Escape. Exit presentation mode
Scheduling dashboard sends (4)
The Schedule menu includes two options: Create Schedule to set up new automated sends, and Manage Schedules to update or remove existing schedules.
Creating a new schedule
When creating a schedule, you'll provide four main pieces of information.
Step 1. Set up schedule
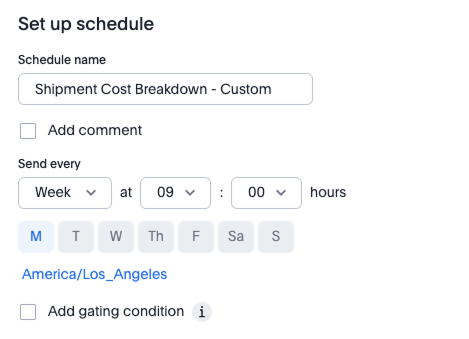
Schedule name. Enter a clear name that works as both an email subject line and a reference for later management.
Add comment. Optionally include details or reminders in the scheduled message, such as a note that the information is proprietary.
Send every. Choose how often the report is sent:
- N minutes. This option will send an email every 5, 10, 15, 20, 30, or 45 minutes on selected days. Shipium recommends this frequency only for testing. Note that the email will be sent only on the days of the week that you select.
- Hour. This option will send an email every 1, 2, 3, 4, 6, 8, or 12 hours on selected days. Note that the email will be sent only on the days of the week that you select.
- Day. This option will send an email every day at a specified time (24-hour format). You can exclude weekends and adjust the time zone.
- Week. - This option will send an email weekly on selected days at a specified time. Setting the time is the same as that for Day above and you will additionally select which days of the week you would like this to be sent.
- Month. This option will send an email monthly on specified dates at a specified time. Enter dates separated by commas (for example,
14,28for the 14th and 28th).
Add gating condition. Optionally require a condition to be met before sending, such as Average Base Rate > 50.0. This is an advanced feature that most users won't need.
Step 2. Select attachment type
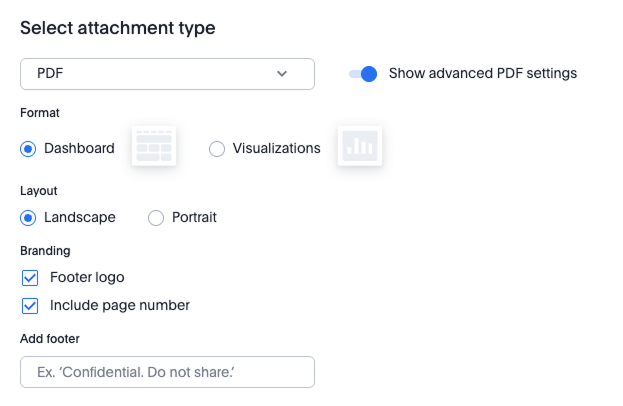
Choose the format for the attached report:
- PDF. See Download a dashboard PDF for all available options.
- XLSX. Any tabular data that is on the page will be included in an XLSX file attached to the email. Charts and graphs are not included.
- CSV. Any tabular data that is on the page will be included in a CSV file attached to the email. Charts and graphs are not included.
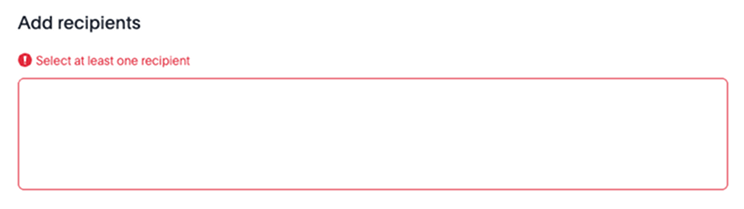
Step 3. Add recipients
Enter the email addresses of recipients. Shipium recommends using an email distribution list to simplify recipient management.
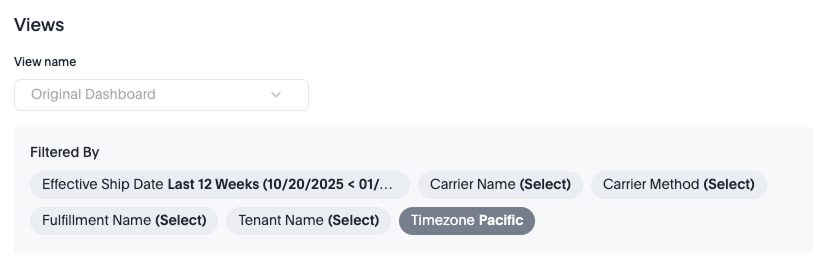
Step 4. Review views
This section displays the current filter settings applied to the dashboard as a reminder. Filters cannot be changed from this screen.
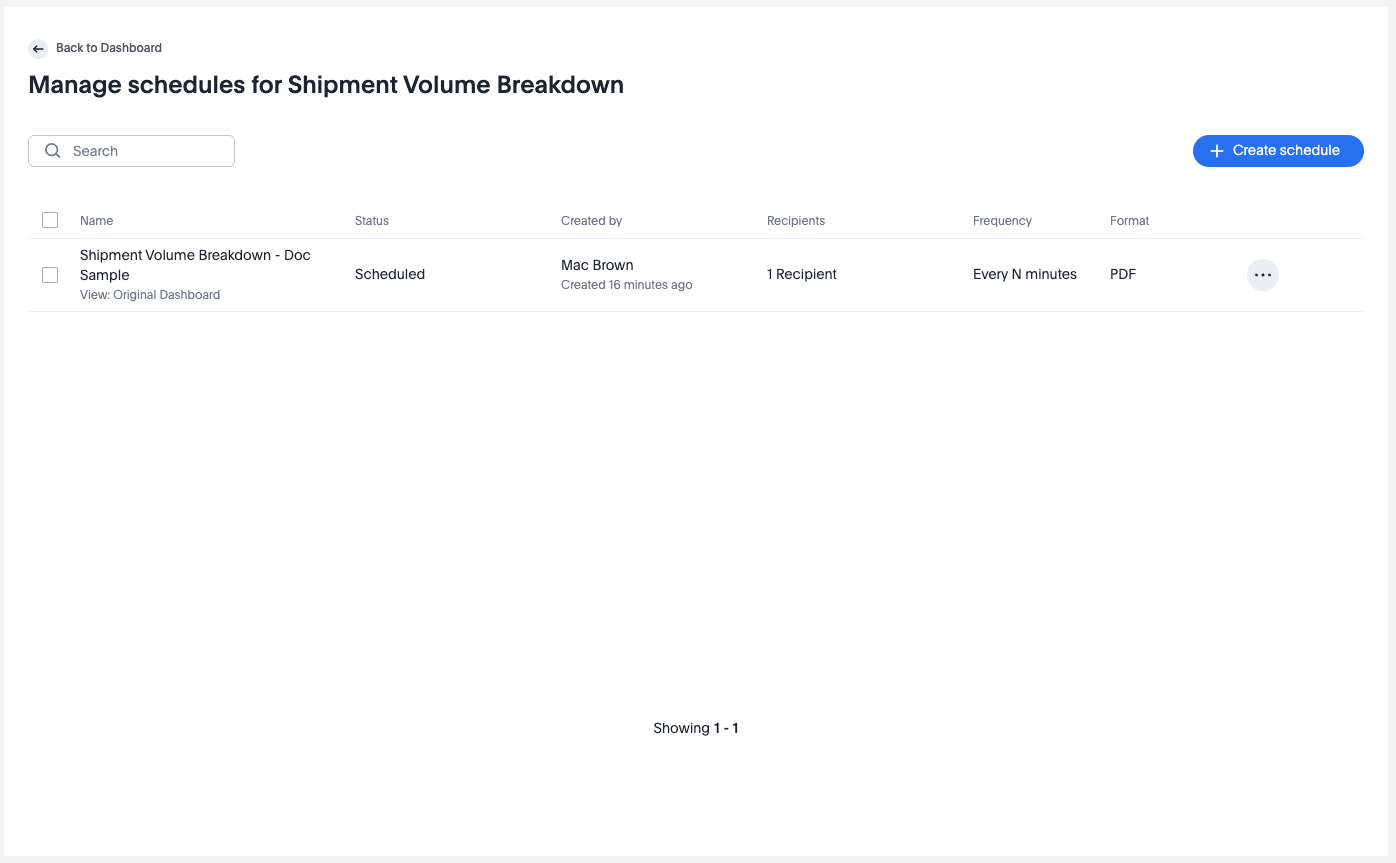
Managing existing schedules
Schedule list
The Manage Schedules screen displays all configured schedules. You can also create new schedules from this screen. The list shows who created each schedule, the number of recipients, and the format and frequency.
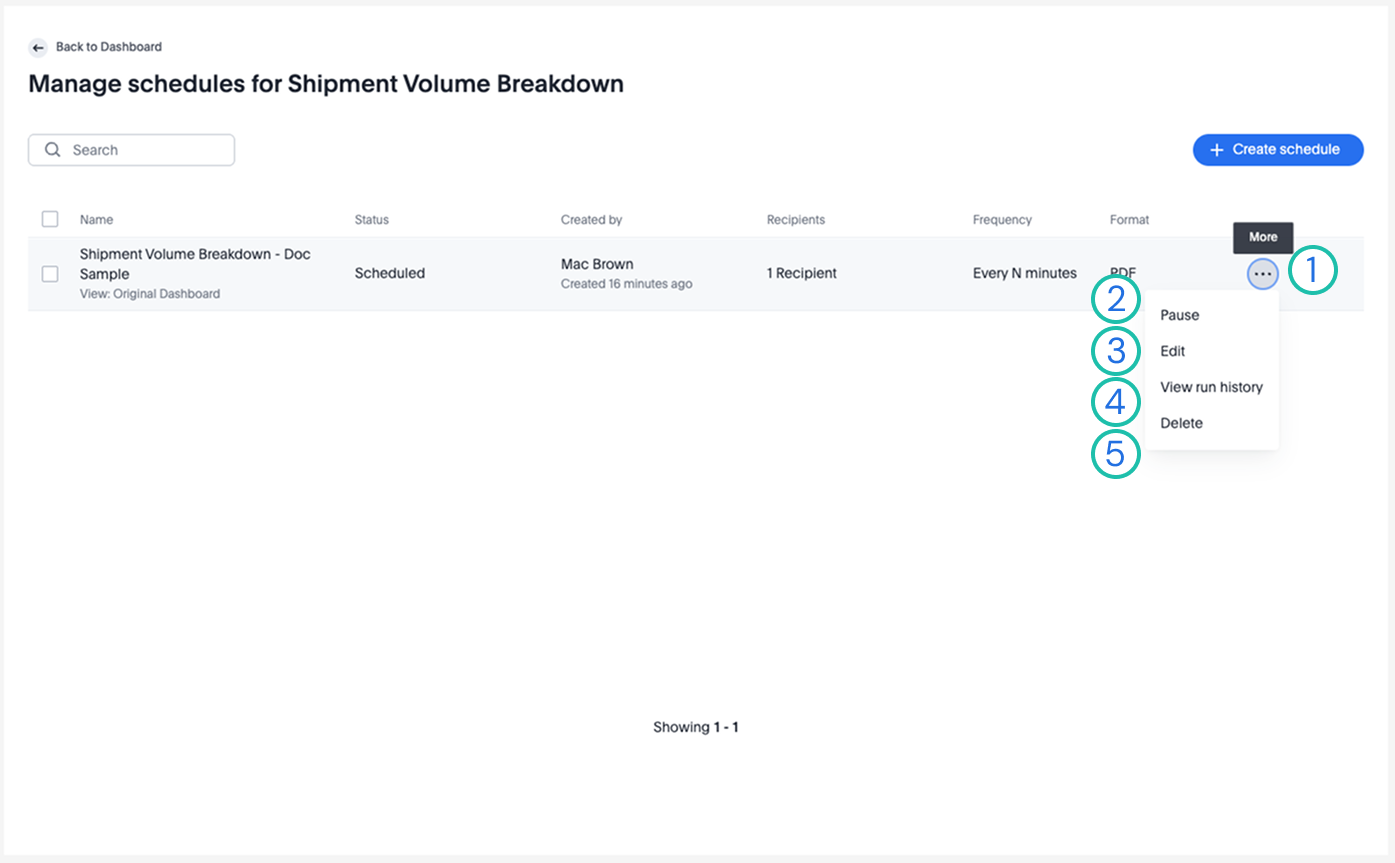
Individual schedule options
The screen below shows the options that are available for each of the schedules that appear on the list. A description of each element is provided in the table below.
| Number | Element | Description |
|---|---|---|
| 1 | Schedule options menu | Click the ... button to open the full options menu. |
| 2 | Pause / Resume | Pause temporarily disables a running schedule without removing it. Resume re-enables a paused schedule. |
| 3 | Edit | Edit opens the schedule for editing. The format of the edit screen is the same as the Create Dashboard screen. |
| 4 | View run history | View run history displays when the schedule has run and whether each run was successful. See Run history below for additional details. |
| 5 | Delete | Delete a given schedule. Note that if this is meant to be temporary, you might wish to use Pause instead. |
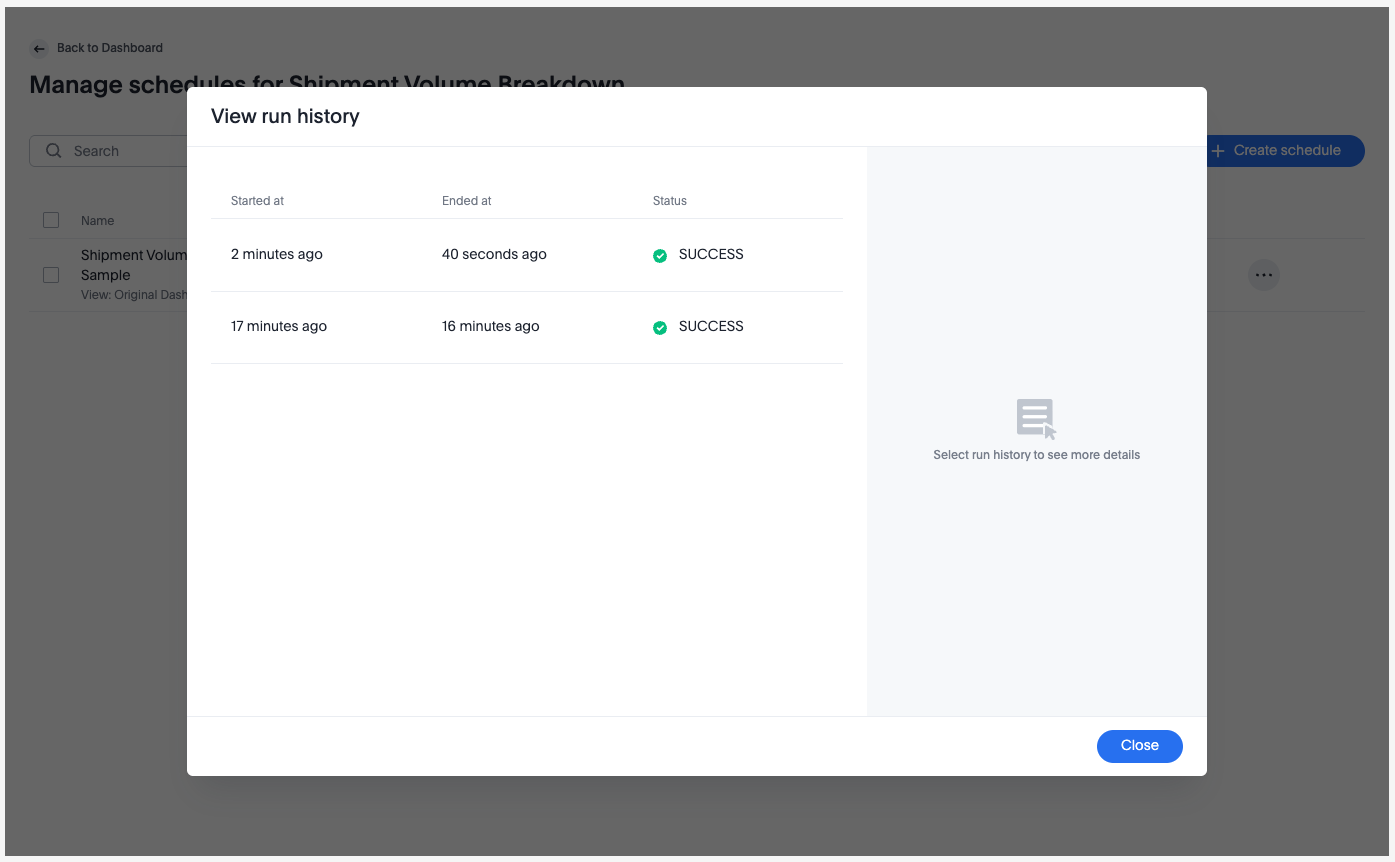
Run history
The View run history screen shows when scheduled sends started, ended, and whether they succeeded. Click any run for additional details, which can help troubleshoot issues.
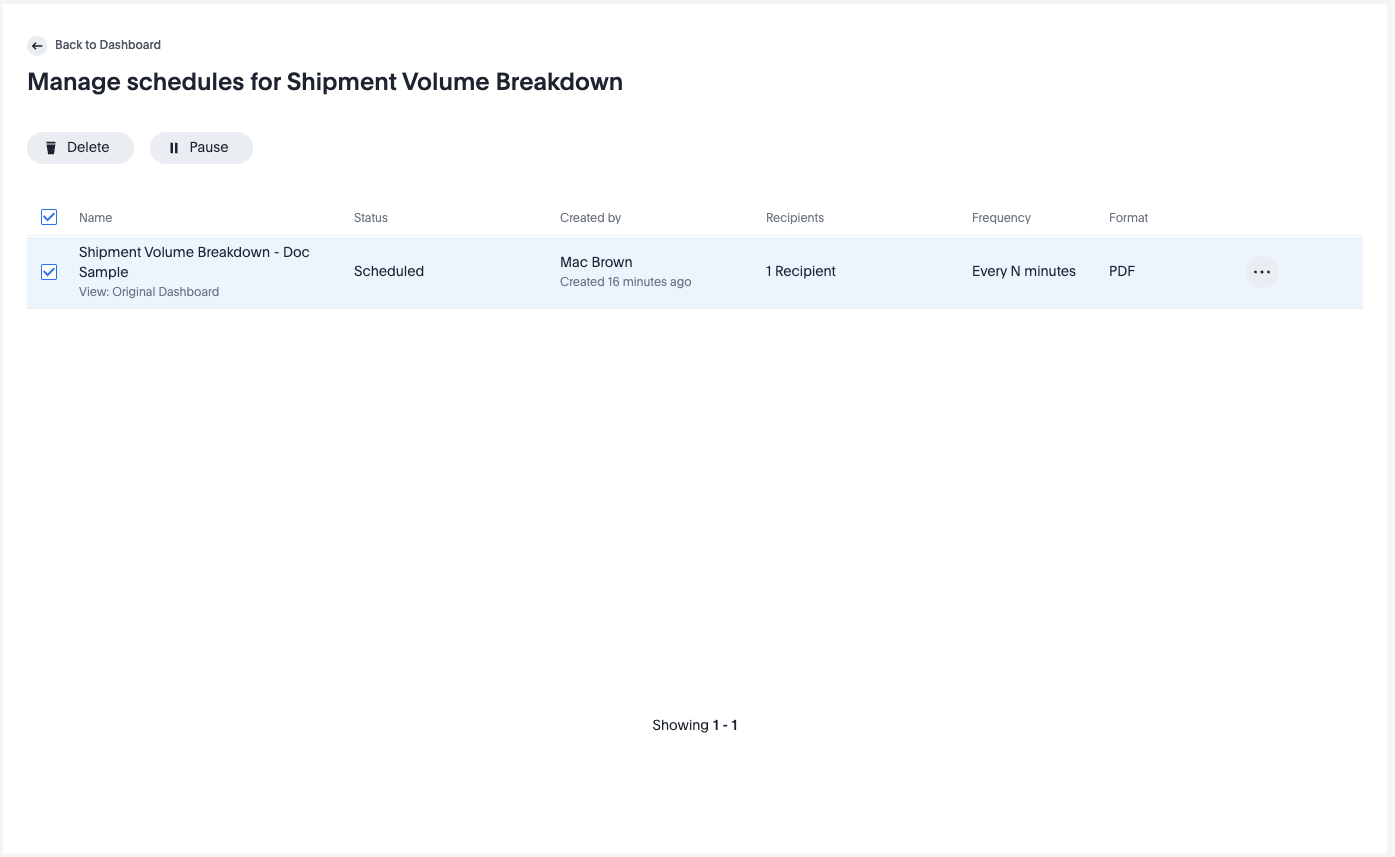
Editing multiple schedules
To Pause, Resume, or Delete multiple schedules at once, select the schedules by clicking their checkboxes. Buttons for these actions appear at the top of the screen.
This is useful for managing temporary reporting (such as during a busy period or carrier launch) or cleaning up multiple test schedules.
Specific Orca AI analytics products
Updated about 2 months ago